
Figure 1. Pairwise correlations between the 742 proteins used in the analyses.
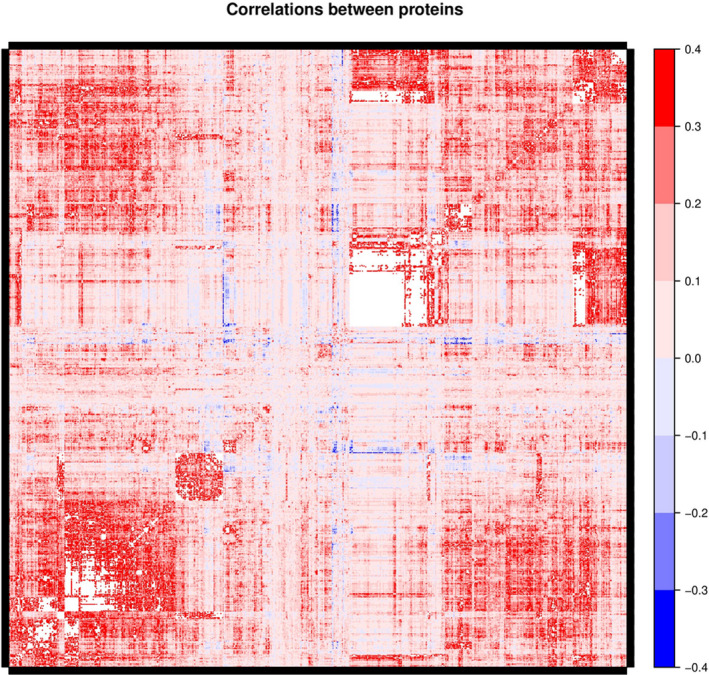
The correlation coefficients are given by the color‐coding at the right. The names of the individual proteins cannot be given in the figure because of limitation in space, therefore the figure gives only an overview of the correlation matrix of the measured proteins.