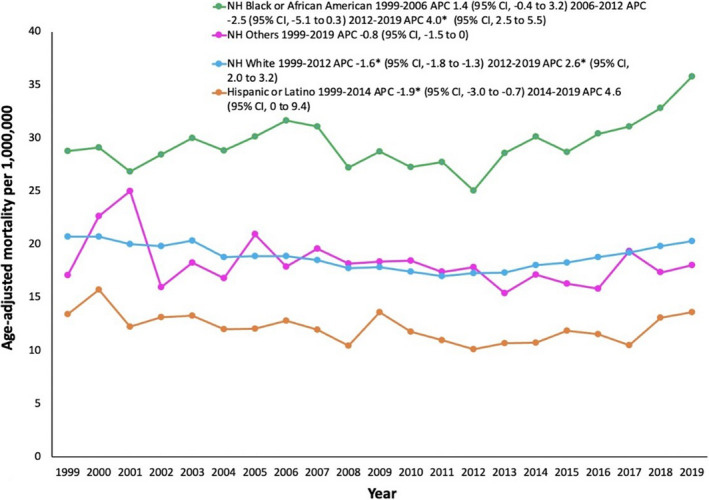
Figure 2. Aortic dissection age‐adjusted mortality rates stratified by race and ethnicity in the United States, 1999 to 2019.

*The annual percent change (APC) is significantly different from 0 at α=0.05. NH indicates non‐Hispanic.

*The annual percent change (APC) is significantly different from 0 at α=0.05. NH indicates non‐Hispanic.