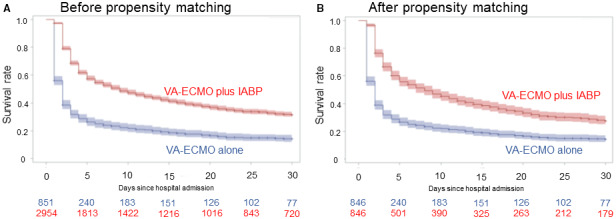
Figure 3. Kaplan–Meier curves for overall survival stratified by treatment strategy.

Kaplan–Meier curves are shown for overall survival up to 30 days after the hospital admission in patients treated with venoarterial ECMO plus IABP vs venoarterial ECMO alone (A) before and (B) after propensity score matching. The color areas around the solid lines indicate 95% CIs. IABP indicates intra‐aortic balloon pumping; and VA‐ECMO, venoarterial extracorporeal membrane oxygenation.
