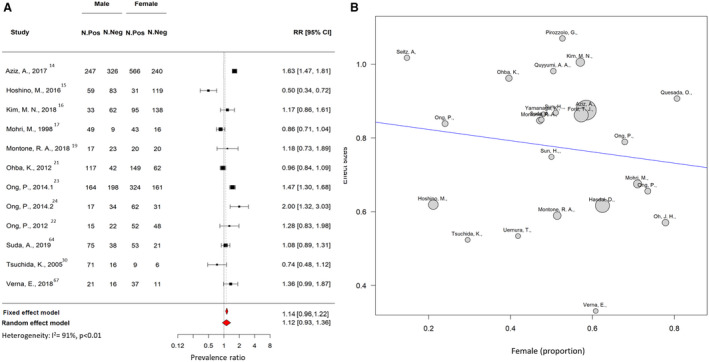
Figure 8. Sensitivity analysis of prevalence of coronary vasospasm according to sex.

A, Forest plot illustrating the risk ratio (RR) and 95% CI of the prevalence of coronary vasospasm according to sex. B, Metaregression plot showing association between the prevalence of coronary vasospasm (y‐axis) and the proportion of women included in each study. The size of the bubble represents the number of patients included in each study. Neg indicates negative; and Pos, positive.
