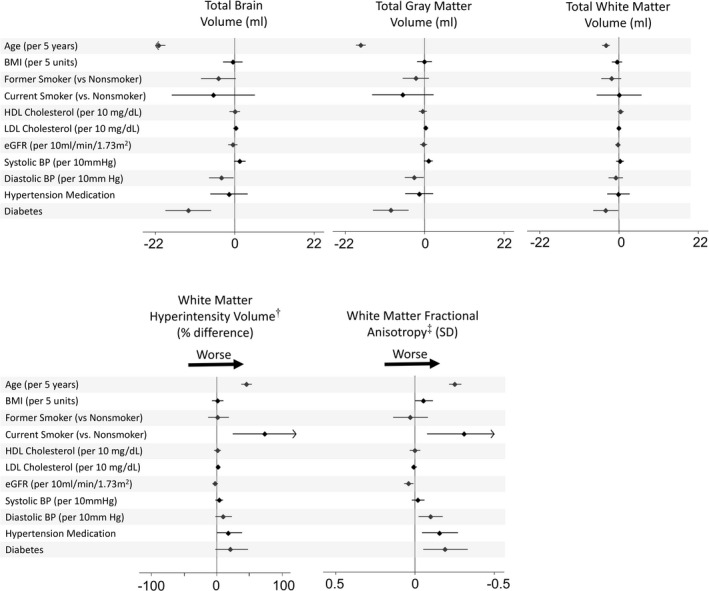
Figure 2. Associations between cardiovascular risk factors and brain MRI measures in 1036 MESA participants based on multivariable* models.

*Regression models include sex, race and ethnicity, MESA site, total intracranial volume (for magnetic resonance imaging volumes), and all cardiovascular risk factors in the leftmost column. †White matter hyperintensity volume presented as percent difference per indicated unit of the exposure based on the geometric mean ratio‡ Fractional anisotropy presented as Z scores; low white matter fractional anisotropy is interpreted as indicating poor white matter integrity. For fractional anisotropy, the x axis has been reversed to aid interpretation. BMI indicates body mass index; BP, blood pressure; eGFR, estimated glomerular filtration rate; HDL, high‐density lipoprotein; LDL, low‐density lipoprotein; MESA, Multi‐Ethnic Study of Atherosclerosis; and MRI, magnetic resonance imaging.
