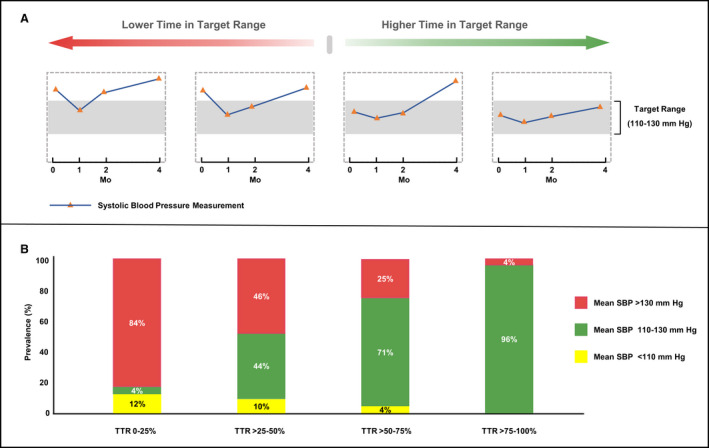
Figure 1. Diagram of time in systolic blood pressure (SBP) target range and stacked bar graphs of mean SBP by time in target range groups.

This figure depicts example of low to high time in SBP target range (A). Participants with higher time in SBP target range tend to have a greater proportion for which the mean SBP was within the target range (B). SBP indicates systolic blood pressure; and TTR, time in target range.
