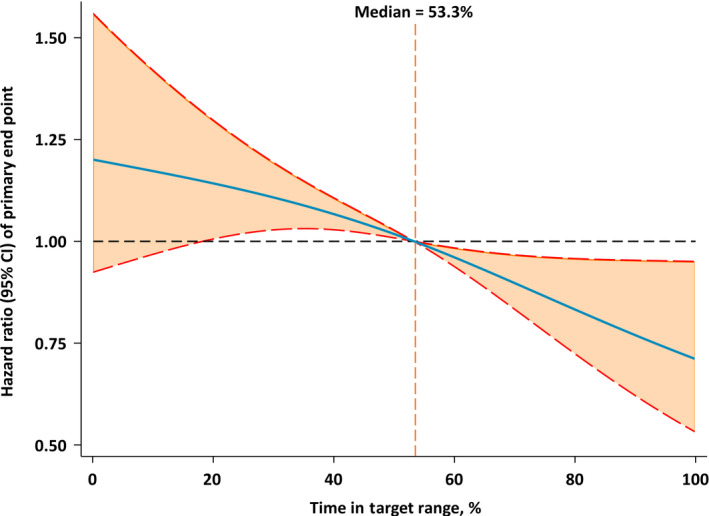
Figure 2. Restricted cubic spline plots for primary end point by time in systolic blood pressure target range.

The figure showed the adjusted hazard ratios of primary end point by time in systolic blood pressure target range. Each hazard ratio was compared with a median time in target range of 53.3%. The blue line represents the hazard ratio of time in systolic blood pressure target range across the whole range. The red lines represent the 95% CI.
