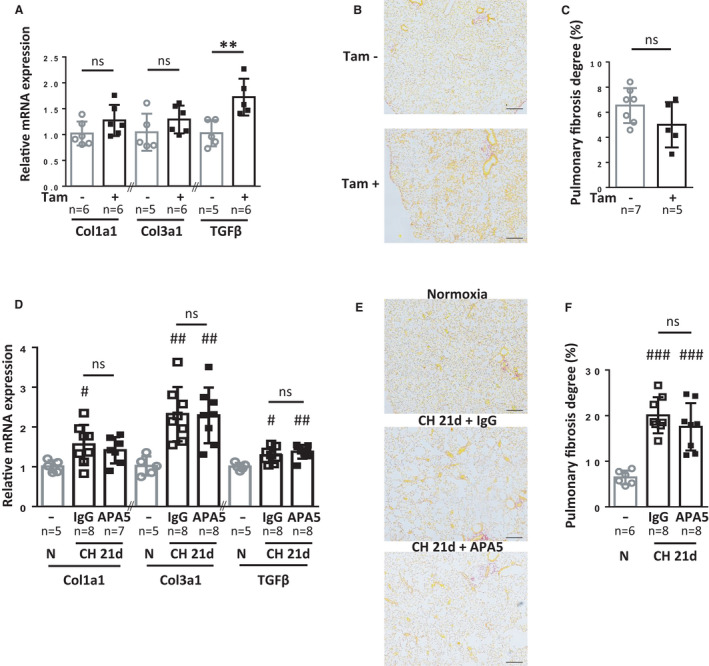
Figure 8. Lung fibrosis is not induced by PDGFRα activation and is not reduced by PDGFRα inhibition.

A through C, Fibrosis evaluation in noninduced (n=6–7) or tamoxifen‐induced PW1nLacz/+/PDGFRα+/(S)K/Rosa‐CRE+ mice 5 weeks after tamoxifen induction (n=5–6). D to F, Fibrosis evaluation in untreated mice under normoxia (n=5) or IgG and APA5‐treated mice after 21 days of CH (n=7–8). A and D, RT‐qPCR measurements of mRNA expression for collagen 1a1, collagen 3a1, and transforming growth factor‐β in lungs. B and E, Representative images of picrosirius red staining for collagen (red) in pulmonary parenchyma. Larger images are displayed in Figures S10 and S11. C and F, Quantification of the picrosirius red‐stained area as a measure of fibrosis using Histolab analysis. Fibrosis area (% of total area) was determined as the mean fibrotic area of four large lung sections for each animal. Bars represent means and whiskers represent SD. *P<0.05, **P<0.01 Tam+ vs Tam‐ group, 2‐tailed Mann‐Whitney; # P<0.05, ## P<0.01 vs normoxic, Kruskal‐Wallis and Dunn. CH indicates chronic hypoxia; ns, not significant for APA5 vs IgG within CH 21d group in D and F (scale bar 200 µm); PDGFRα, platelet‐derived growth factor receptor type α; PW1, protein widely 1; and RT‐qPCR, reverse transcriptase quantitative polymerase chain reaction.
