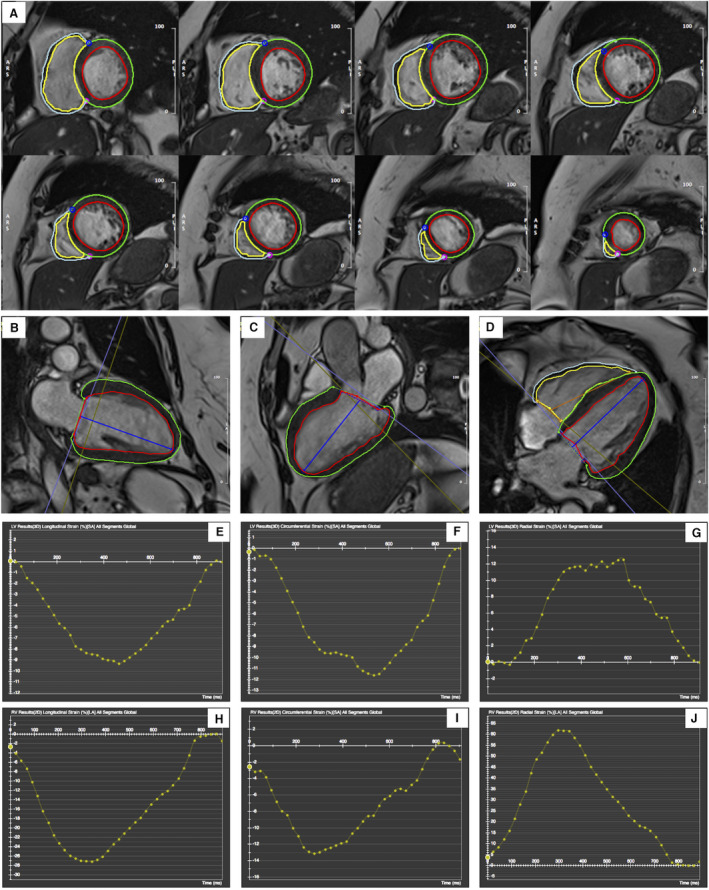
Figure 1. Left ventricular (LV) and right ventricular (RV) cardiac magnetic resonance feature tracking in the short‐axis (A), and 2‐chamber (B), 3‐chamber (C), and 4‐chamber (D) cine images at end‐diastole.

The red and green curves delineate the endocardial and epicardial contours in LV, respectively; the yellow and cyan curves delineate the endocardial and epicardial contours in the RV, respectively. The blue and magenta points represent the superior and inferior RV insertion points on short‐axis cines (A). The blue (LV) and orange (RV) lines are used to define the base and apex of the mitral annulus plane and the apical plane (B through D). Representation of LV global longitudinal strain, global circumferential strain, and global radial strain curves using 3D cardiac magnetic resonance feature tracking (E through G). Representation of RV global longitudinal strain, global circumferential strain, and global radial strain curves using 2D cardiac magnetic resonance feature tracking (H through J).
