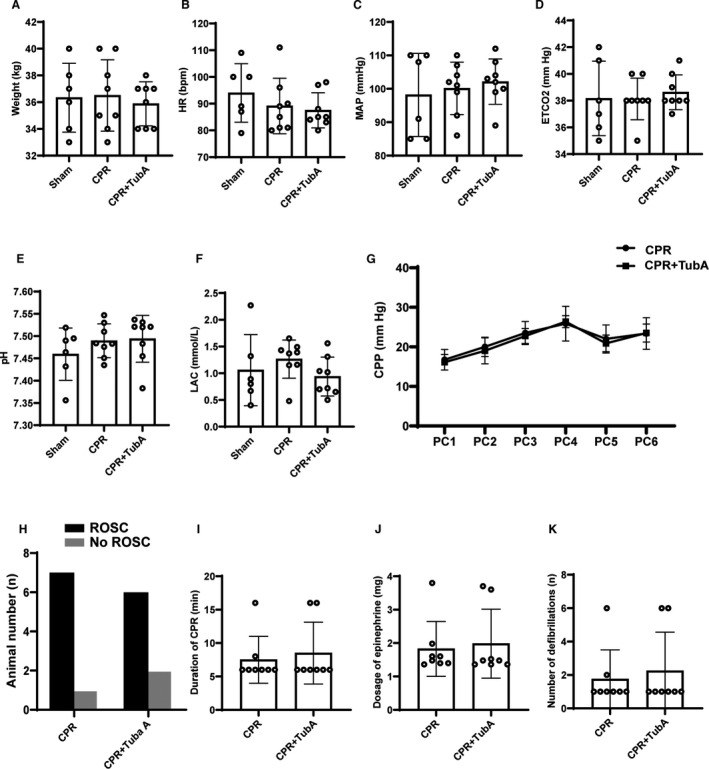
Figure 5. Baseline characteristics and cardiopulmonary resuscitation (CPR) outcomes of the animal study.

A through F, Baseline body weight (BW), heart rate (HR), mean arterial pressure (MAP), end‐tidal CO2, and arterial pH and lactate (LAC). G, The changes of coronary perfusion pressure (CPP) during CPR. PCn indicates n minutes after precordial compression. H through K, Return of spontaneous circulation (ROSC), duration of CPR, dosage of epinephrine and number of defibrillations during CPR. A through K, The sham group contained 6 swine at baseline, and the other 2 groups had 8 swine at baseline and during CPR. Data were presented as mean±SD in BW, HR, MAP, end‐tidal CO2, pH, LAC and CPP, in which group comparisons were performed by 1‐way ANOVA with Bonferroni test or Student t test. Data were presented as median (25th–75th percentiles) in duration of CPR, dosage of epinephrine, and number of defibrillations, in which group comparisons were performed by Kruskal‐Wallis test. ROSC was compared with Fisher’s exact test.
