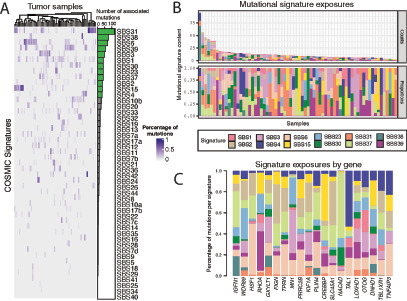
FIGURE 2.

Characterization of mutational processes. A, Heat map showing the contribution of each of the 47 COSMIC mutation signatures to each individual tumor. B, Number (top) and proportion (bottom) of mutations in each tumor that are attributed to the top 12 most prevalent signatures. C, Relative enrichment of the top 12 most prevalent signatures in the 20 most recurrently mutated genes.
