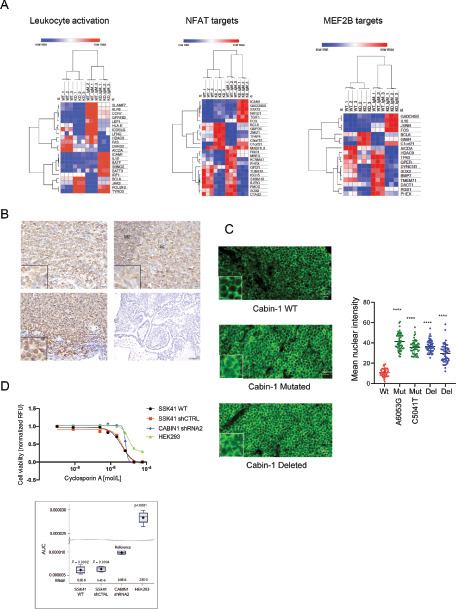
FIGURE 6.

Effects of CABIN1 alterations on gene expression and NFAT activation. A, Heat maps showing FPKM values of genes that are differentially expressed in WT versus CABIN1 KD SSK41 cells after α-IgM F(ab’)2 stimulation. These genes are significantly enriched for leukocyte activation signature, NFAT and MAF2B targets. B, IHC analysis of NFAT expression and localization in OAMZL tumors with WT CABIN 1 (top left) and CABIN1 CN losses (bottom left). For control, NFAT antibody staining showed cytosolic expression in germinal center of normal lymph nodes (top right), while no staining detectable in the uterus (bottom right). Magnification: top left and right and bottom left, 40×; bottom right, 10×. Insets, 100×. C, NFATc1 (green) immunofluorescence in OAMZL tissue sections with WT and mutated CABIN1. Image analysis of mean nuclear fluorescence signal intensities were done using ImageJ software. ****, P < 0.0001. D, Cell viability assay of SSK41 WT, shRNA control, and CABIN1 KD cells treated for 72 hours with increasing concentrations of cyclosporin A. HEK293 cells are not sensitive to cyclosporin A and were used as control.
