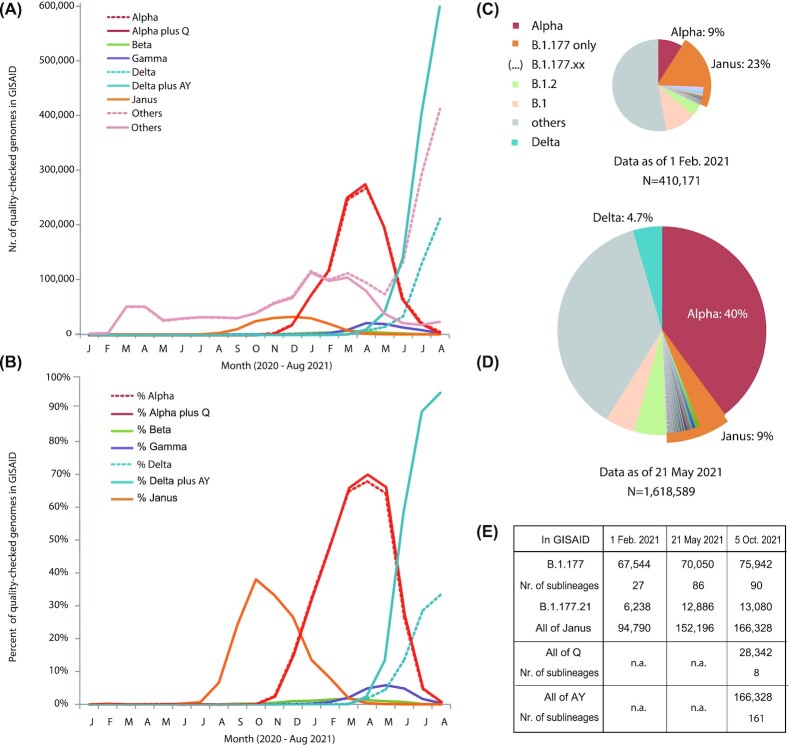
Figure 5.
Trends over time for the major VoCs and Janus. Panel (A) shows absolute numbers recorded per month, based on data downloaded from GISAID on 5 October 2021. Panel (B) shows the same data as fractions of the total, illustrating the waves of Janus, Alpha and Delta. The other VoCs were far less significant on a global scale, based on the submitted genome sequences. Dotted lines in panels (A) and (B) represent numbers for the strictly recorded Alpha and Delta variants, while solid lines represent numbers when variants of Q were added to Alpha and AY variants were added to Delta. Since sequencing and submitting genomes takes time, September 2021 is not included in the graphs. Panels (C) and (D) show the fractions of lineages belonging to Janus (B.1.177 and the various B.1.177.XX lineages), based on the datasets of 1 February and 21 May, respectively. Panel (E) shows how Janus is broken up in various sublineages, whose numbers vary over time, and how offspring of Alpha became variants of Q and that of Delta became multiple variants of AY. n.a.: not applicable.

