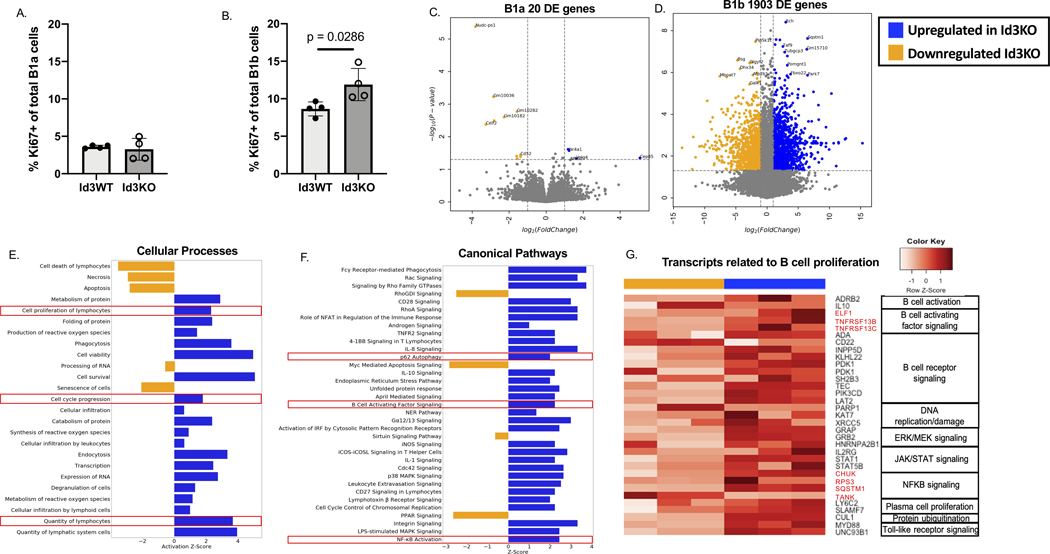
Figure 1: Loss of Id3 promoted BAFF-P62-NFKB expression and proliferation in B1b but not B1a cells.
(A-B) Percentage of Ki67+ of total B1a (A) and B1b (B) obtained from Id3WT (n = 4) and Id3KO (n =4) peritoneal cells (C-D) Volcano plots compared between Id3WT (yellow, n = 3) vs Id3KO (blue, n = 3) B1a (C) and B1b (D) cells obtained from peritoneal cavity. (E-F) Cellular processes (E) and canonical (F) pathway analysis determining pathways downregulated in Id3KO (yellow) and upregulated in Id3KO (blue) B1b cells. (G) Transcripts related to B cell proliferation categorized by canonical pathways downregulated in Id3KO (yellow) and upregulated in Id3KO (blue) in B1b cells. Results were represented with Mean ± SD with unpaired Mann-Whitney t-test.

