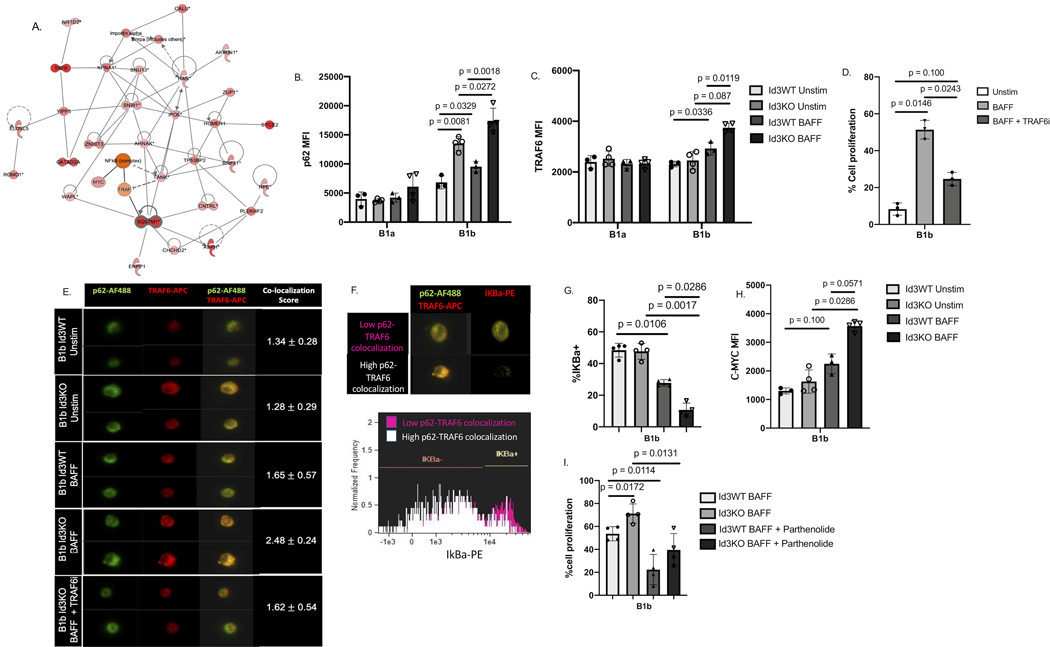
Figure 4: BAFF induced binding of P62 to TRAF6 in B-1b, but not B-1a cells, leading to NFKB activation and upregulation of c-myc driven cell proliferation.
(A) protein interaction analysis indicated SQSTM1/P62 interaction with proteins related to cell proliferation and cell cycle. (B-C) MFI of P62 (B) and TRAF6 (C) on Id3WT (n = 4) and Id3KO (n = 4) B1a and B1b cells under unstimulated and BAFF stimulated conditions. (D) percentage of in vitro cell proliferation of total B1b (n = 4) measured by Celltrace -violet under unstimulated, BAFF stimulated, and BAFF + TRAF6 inhibitor conditions. (E) Co-localization between P62 and TRAF6 on B1b cells (n = 3, 1,000 B1b cells per mouse) under unstimulated, BAFF stimulated, and BAFF + TRAF6 inhibitor conditions quantified by imaging flow cytometry. (G) Representative images of IKBa degradation with low and high P62 and TRAF6 co-localization. (G) percentage of IKBa+ on Id3WT (n = 4) and Id3KO (n = 4) B1b cells under unstimulated and BAFF stimulated conditions. (H) MFI of C-MYC on Id3WT (n = 4) and Id3KO (n = 4) B1b cells under unstimulated and BAFF stimulated conditions. (I) percentage of in vitro cell proliferation of total Id3WT (n = 4) and Id3KO (n = 4) B1b measured by Celltrace -violet under BAFF stimulated, and BAFF + Parthenolide inhibitor conditions. Results were represented with Mean ± SD. Statistical analyses were performed using Kruskal-Wallis test with Dunn’s correction for multiple comparison.

