
Figure 5.
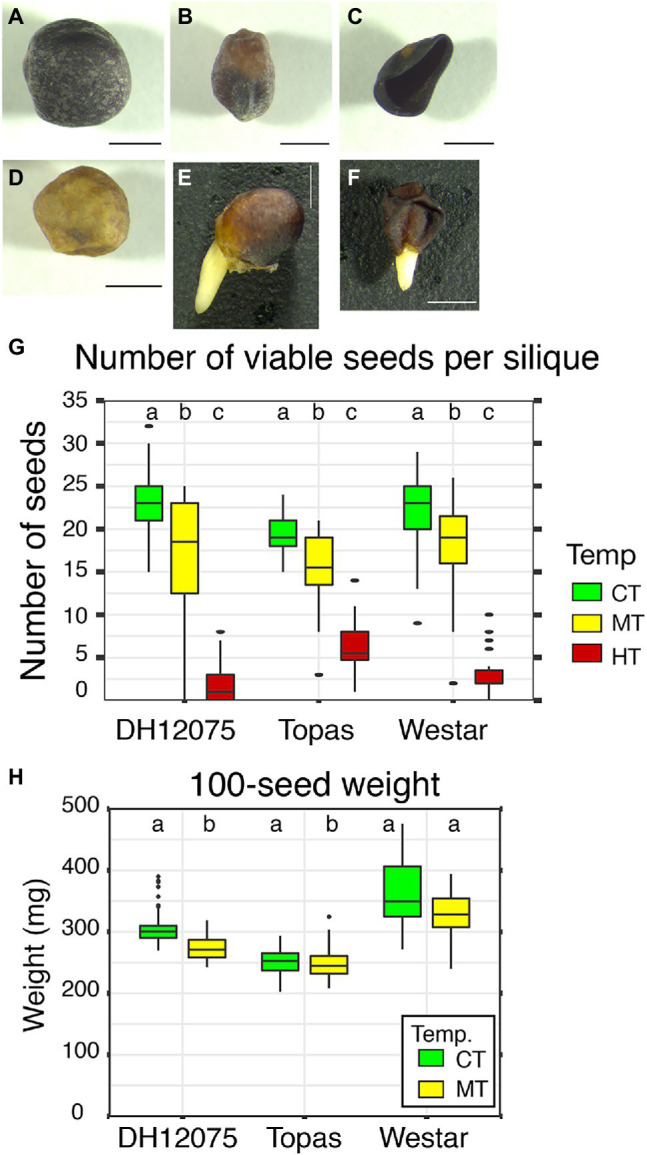
Effects of high temperatures on seed development. (A–F) Range of phenotypes observed in mature seeds. We observed normal fully filled seed (A), partially filled seed (B), flatten shrunken seed (C), partially filled yellow seed (D), sprouting fully filled seed (E), sprouting flatten shrunken seed (F). Scale bars represent 1 mm. (G) Graph displaying the number of viable seeds per silique in DH12075, Topas, and Westar cultivars at CT (green), MT (yellow), and HT (red). (H) Graph displaying 100-seed weight in DH12075, Topas, and Westar cultivars at CT (21/18°C, green) and MT (28/18°C, yellow). The data (G,H) are presented in boxplots. The box represents the interquartile range, and the black line inside the box represents the median. Dots represent outliers. Boxes with the same letters (a, b, and c) within each cultivar do not differ significantly (p < 0.05).