
Figure 7.
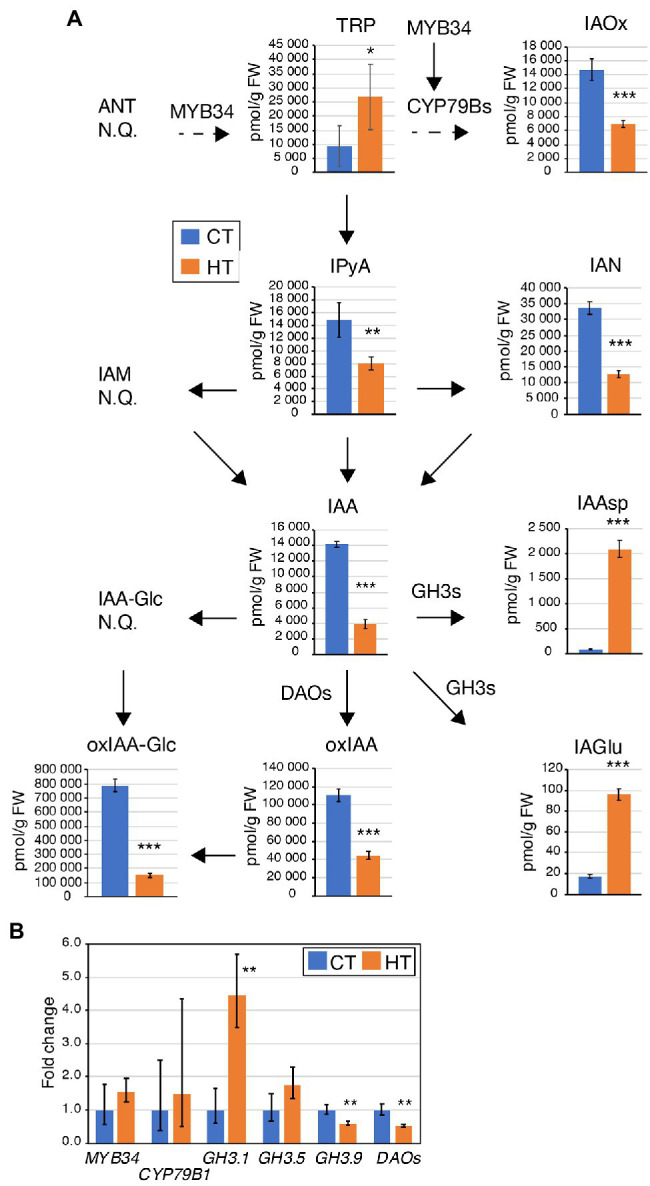
Differences in auxin and auxin metabolites levels and enzyme expression induced at HT in Westar 26 DAP seeds. (A) Graphs displaying the levels (pmol/g FW) of tryptophan (TRP), indole-3-acetaldoxime (IAOx), indole-3-pyruvic acid (IPyA), indole-3-acetonitrile (IAN), indole-3-acetic acid (IAA), IAA-aspartate (IAAsp), IAA-glutamate (IAGlu), 2-oxoindole-3-acetic acid (oxIAA) and oxIAA-glucose (oxIAA-Glc). Anthranilate (ANT), indole-3-acetamide (IAM), IAA-glucose (IAA-Glc) were not quantified (NQ). Measurements were done in two biological replicates, five technical replicates in Westar 26 DAP seeds from plants grown at CT (blue) and HT (orange). Shown is the average ± SD of one of the two biological replicates. Asterisks indicate statistically significant difference in HT in a paired Student’s t-test (t-test; *, **, and *** correspond to value of p 0.05 > p > 0.01, 0.01 > p > 0.001, and p < 0.001, respectively). Arrows indicate the direction of the biosynthesis pathway (plain arrow, direct reaction; dashed arrow, multiple-step enzymatic reactions). The names closed to the arrows indicate the enzymes involved in the reactions and whose gene expression was tested (B). Source data are shown in Supplementary Table S3. (B) Expression analysis by RT-qPCR of BnaMYB4, BnaCYP79Bs, BnaGH3.1, BnaGH3.5, BnaGH3.9, and BnaDAOs in Westar 26 DAP seeds. The graph displays the fold changes in expression between CT (blue) and HT (orange). Asterisks indicate statistically significant difference in HT in a paired Student’s t-test (t-test; ** corresponds to value of p 0.01 > p > 0.001). Primers and LOC information are presented in Supplementary Table S1.