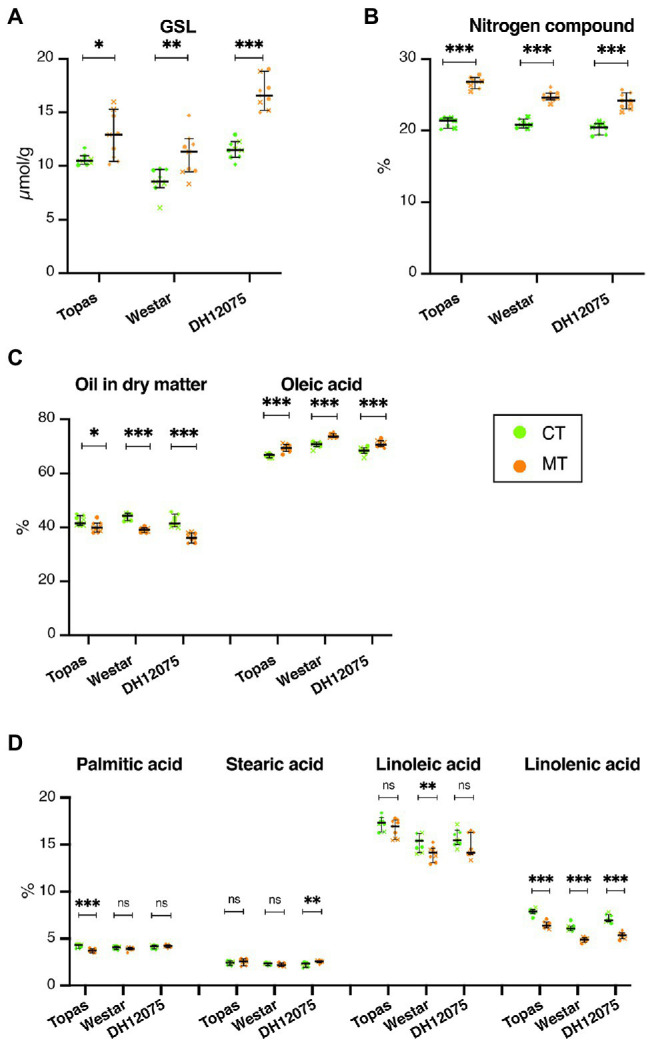
Figure 9.

Differences in Glucosinolates (GSL), Nitrogen, and seed oil levels induced at MT. (A–D) Graphs are displaying the levels of glucosinolates (GSL in 9% humidity, μmol/g; A), nitrogen compound (%; B), total oil in dry matter (%) and oleic acid (% of total oil; C), palmitic acid (% of total oil), stearic acid (% of total oil), linoleic acid (% of total oil) and linolenic acid (% of total oil; D) at CT (green) and MT (orange) in Topas, Westar and DH12075 cultivars. The data from three biological replicates are plotted (•, replicate 1; ×, replicate 2; ♦, replicate 3). The horizontal line represents the median with 95% CI. Asterisks indicate statistically significant difference in MT in a paired Student’s t-test (t-test; *, **, and *** correspond to value of p 0.05 > p > 0.01, 0.01 > p > 0.001, and p < 0.001, respectively). Source data are found in Supplementary Table S6. The measurements were done in three biological replicates, each in three technical replicates.
