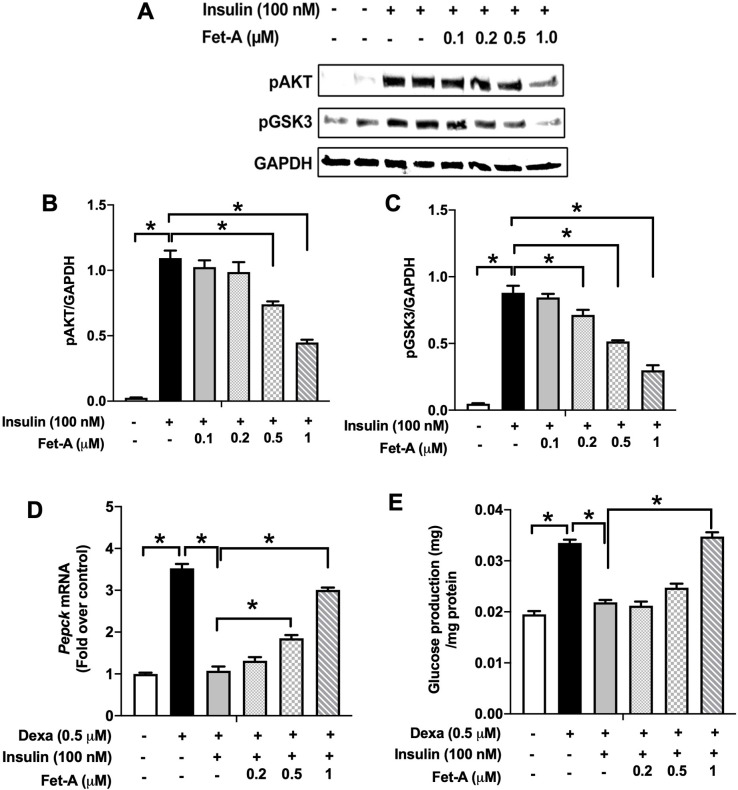
Fig 1. Effect of fetuin-A (Fet-A) on insulin signaling and insulin mediated suppression of gluconeogenesis and glucose production in HepG2.
[A] HepG2 cells were pre-treated with recombinant Fet-A in the presence or absence of insulin, and cell lysates were subjected to immunoblotting for AKT and GSK3 phosphorylation status (n = 3). [B] Quantified data of the ratio of cellular pAKT/GAPDH immunoblots (n = 3) and C] ratio of cellular pGSK/GAPDH immunoblots (n = 3) are shown. [D] HepG2 cells were serum-starved for 6 h, followed by treatment with dexamethasone (Dexa), insulin, or insulin and Fet-A for 12 h. Real-time gene expression of Pepck were analyzed (n = 4). [E] To analyze glucose production, HepG2 cells (n = 4) were treated with 0.5 μM dexamethasone and 0.1 mM 8-CTP-cAMP (Dex/cAMP), various concentrations of Fet-A or 100 nM insulin (Ins) in glucose free DMEM medium (pH 7.4 supplied with 20 mM sodium lactate and 2 mM sodium pyruvate) for 5 h. Glucose production was assayed by measuring glucose concentration in the medium as described previously [33]. Data are shown as Means ± SEM. P values were determined by one-way ANOVA followed by Tukey’s multiple comparison tests (A-C). Data are representative of at least three independent experiments performed in replicates. * Indicates p < 0.05.

