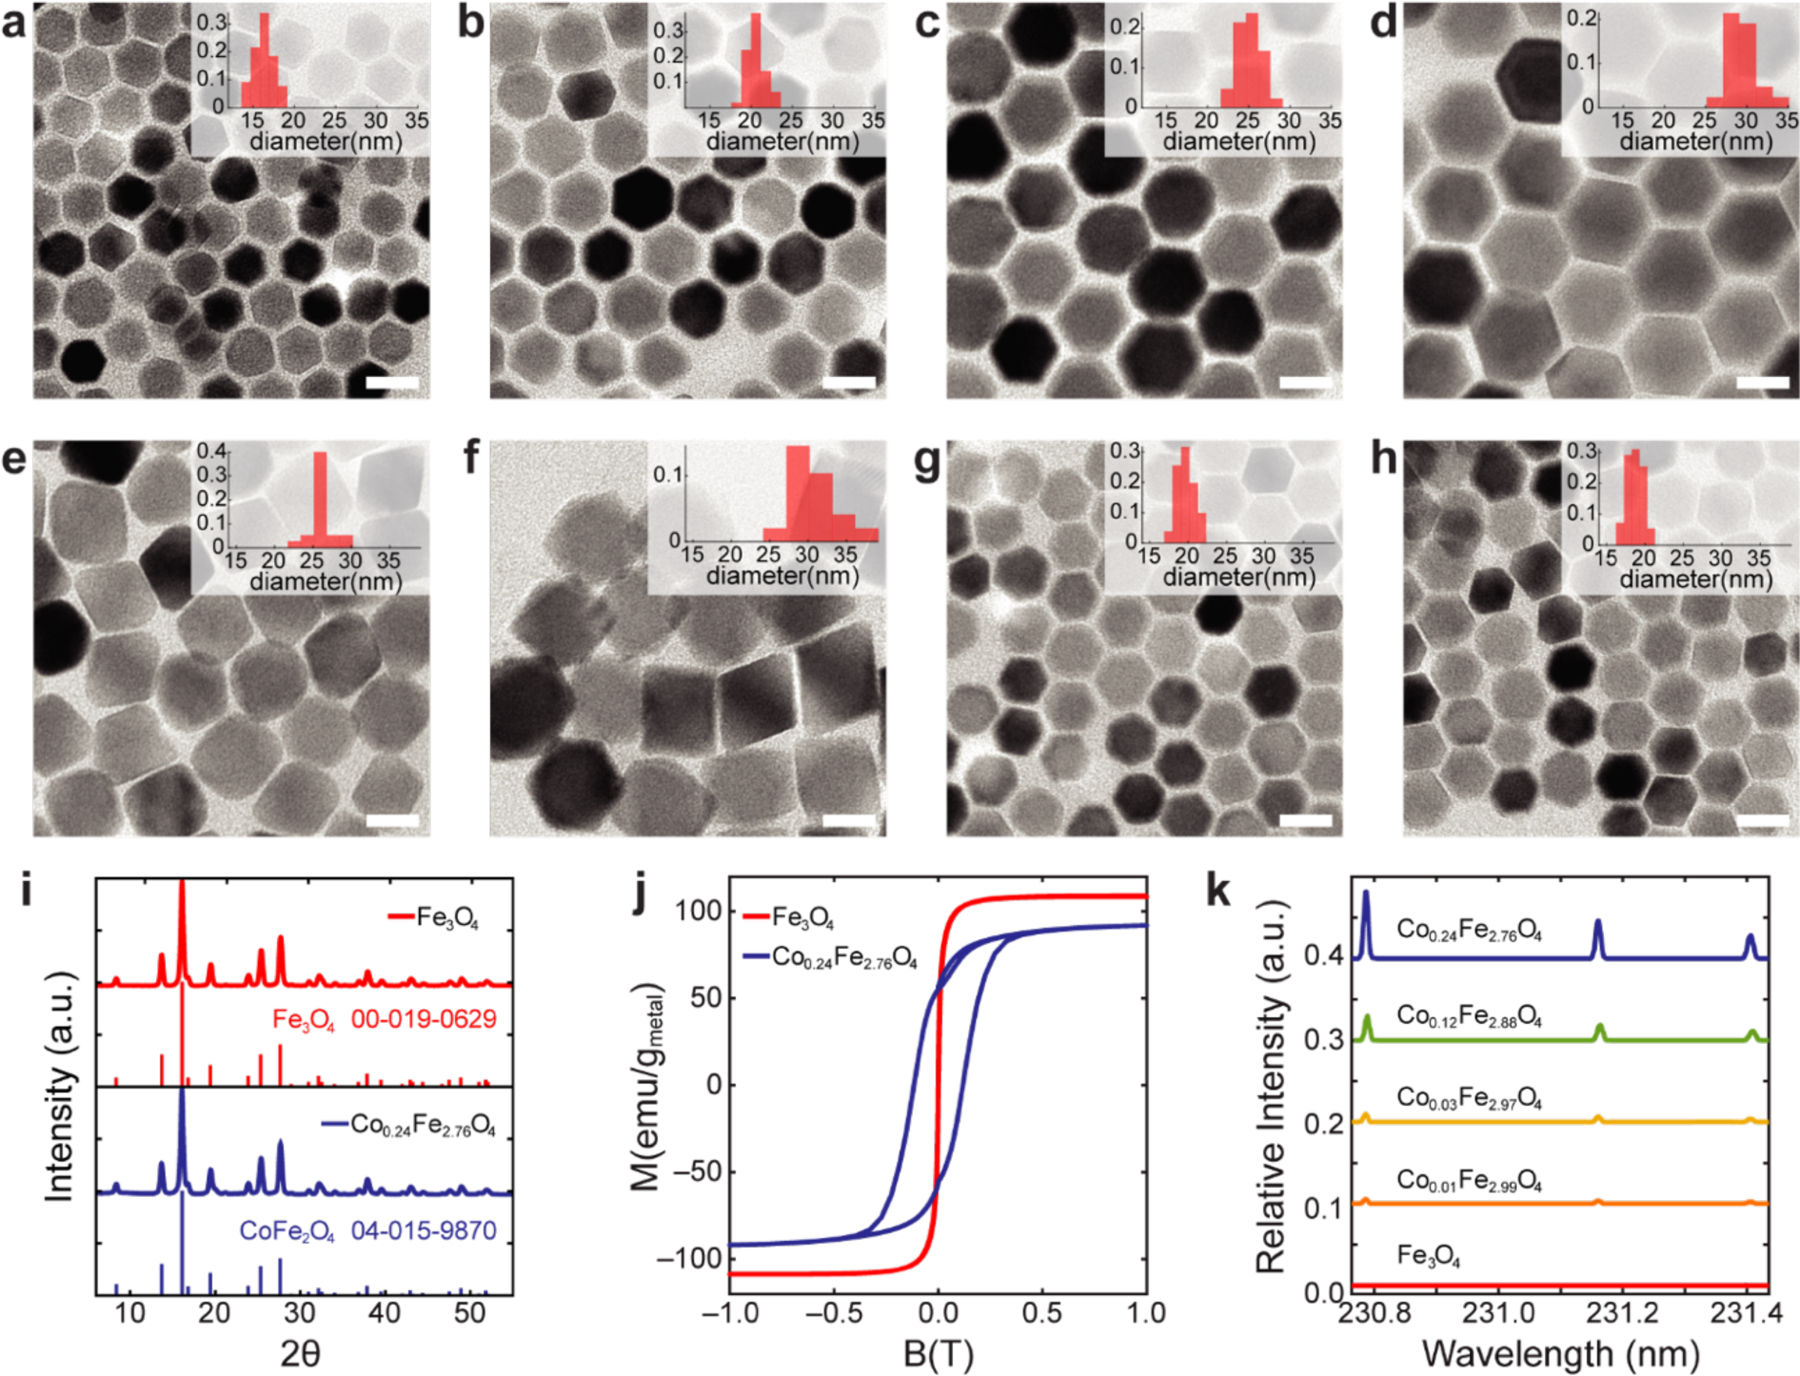
Figure 2.

Characterization of magnetic nanoparticles. (a-h), TEM of Fe3O4 (a-d) and CoxFe3-xO4 (e-h) magnetic nanoparticles and their size distributions from TEM (inset histograms). (i) Powder XRD of Fe3O4 and CoxFe3-xO4 nanoparticles indicates single-crystal structure (inverse spinel). (j) Magnetization data were collected with a SQUID magnetometer to confirm the difference between hard and soft MNPs. To exclude physical rotation of suspended magnetic particles in water, the measurement was performed at 260K. (k) Incorporated cobalt concentration in each ensemble was analyzed by ICP-AES. Each line shows relative cobalt intensity to iron intensity at 234.830nm.
