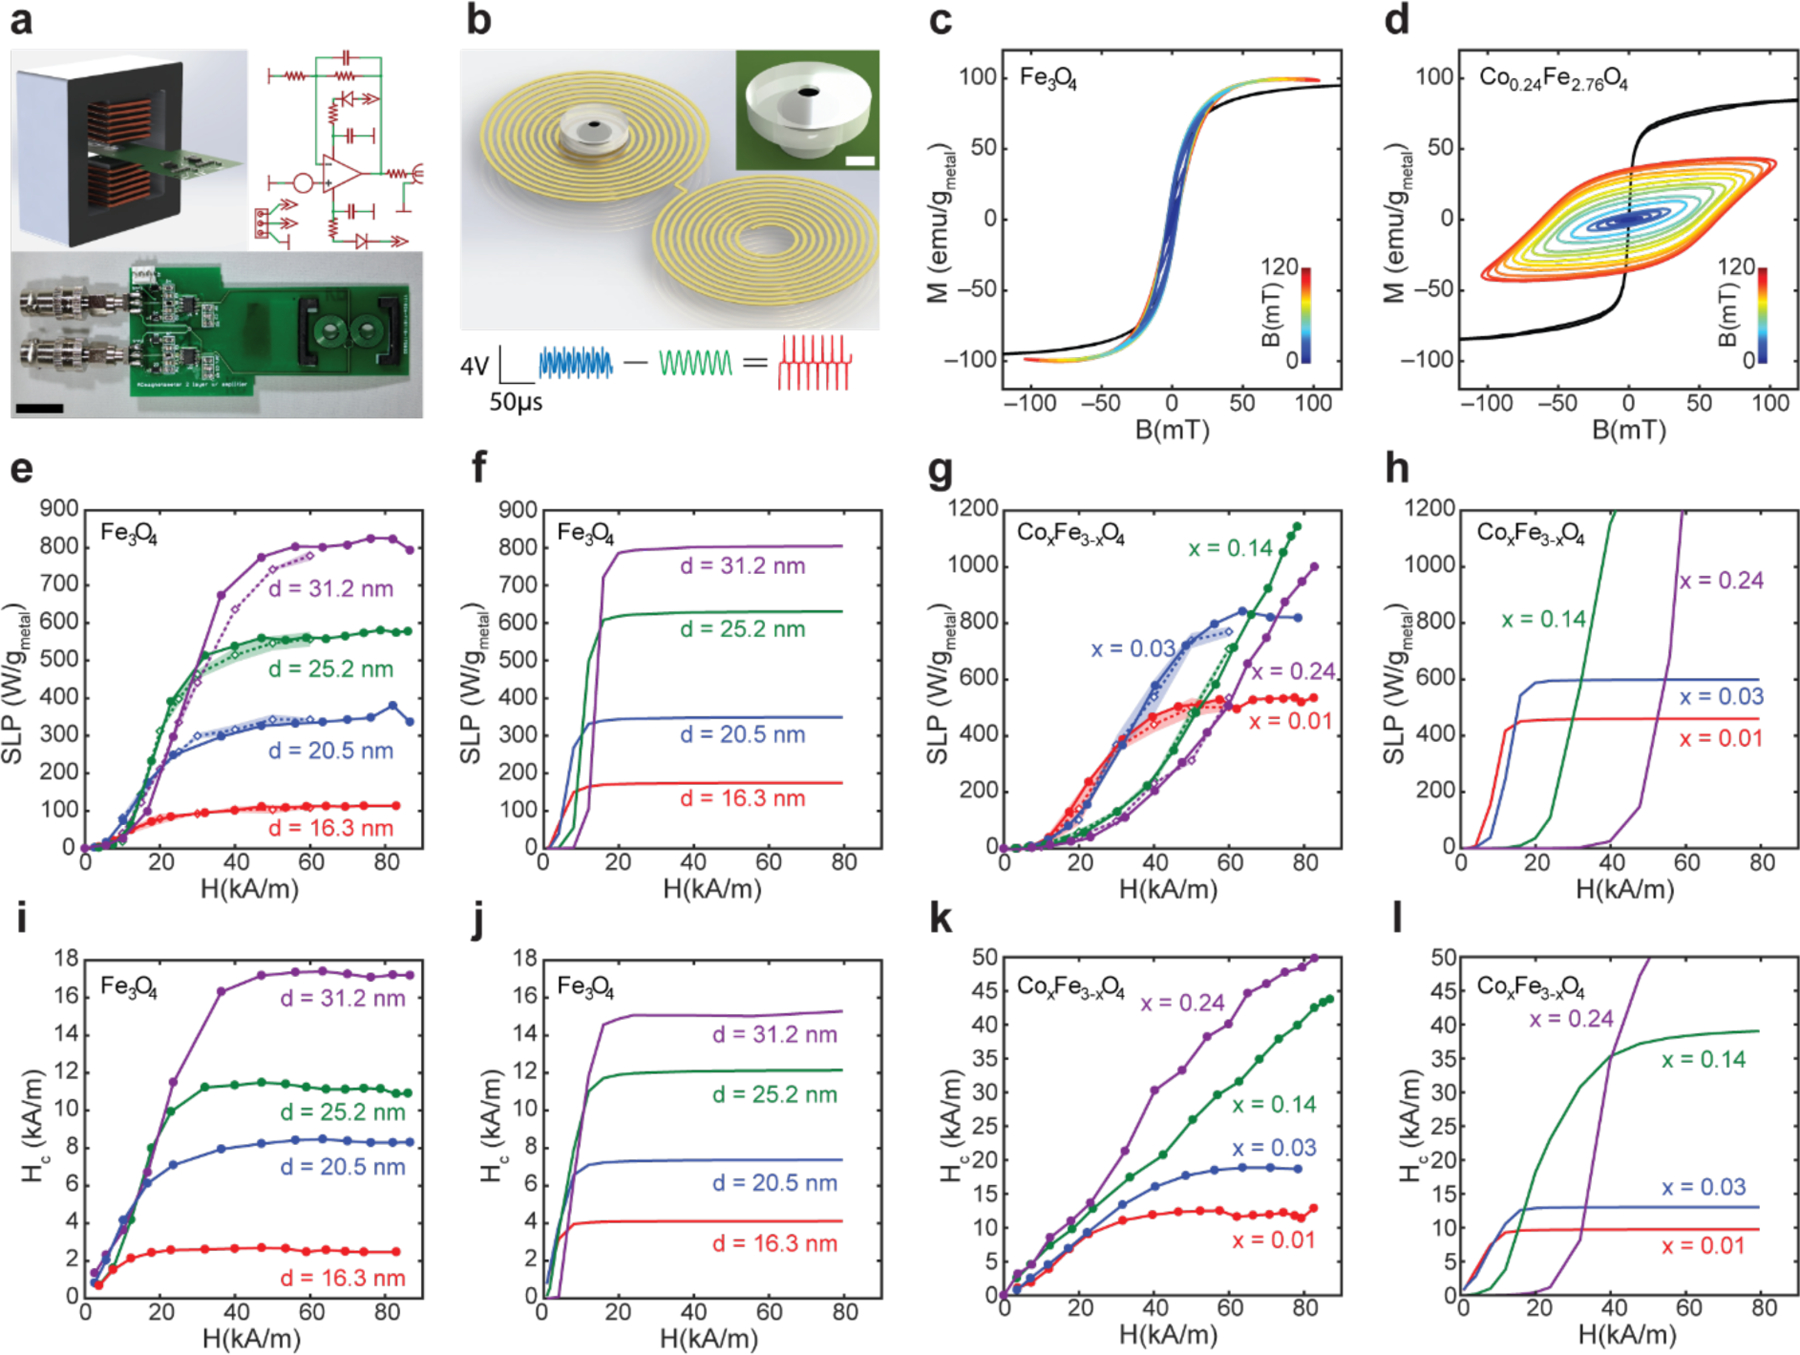
Figure 3.

Measurement of dynamic magnetization of MNP ensembles using custom high amplitude AC-magnetometer. (a) Design, photograph, and circuit diagram of the custom AC-magnetometer (ACM) used to capture dynamic magnetization under AMF. (Scale bar = 1 cm). (b) 2D coil design to detect dynamic magnetization. The spiral design of the sense coil results in a voltage induced by the changing magnetization of the sample. The compensation coil wound in the opposite direction cancels the majority of the voltage induced by the driving AMF. Ferrofluid is loaded into the 3D printed hollow spherical chamber of the sample holder. (Scale bar 1 = mm) (Blue – raw sample signal, Green – water control sample signal, Red – net sample signal). (Scale bars: voltage = 4V, time = 50 μs). (c, d) Dynamic hysteresis loops for ferrofluids of 16.2 nm Fe3O4 (c) and 16.3 nm Co0.24Fe2.76O4 (d) were collected at room temperature under AMFs with ƒ = 75 kHz and amplitudes ranging 0–120 mT. (Black line represents VSM data, jet color lines correspond to ACM data). (e-h), Specific loss power (SLP) of MNP ensembles measured empirically via ACM (e, g – solid lines, closed circle markers, measured at 75 kHz and linearly scaled by frequency to 101.2 kHz) and calorimetry (e, g - dashed lines, open diamond markers, shadowed areas represent standard deviation, measured at 101.2 kHz), and calculated via dynamic hysteresis model (f, h). (i-l) Coercive fields Hc for MNP ensembles calculated from ACM measurements (i, k) and simulated via the dynamic hysteresis model (j, l).
