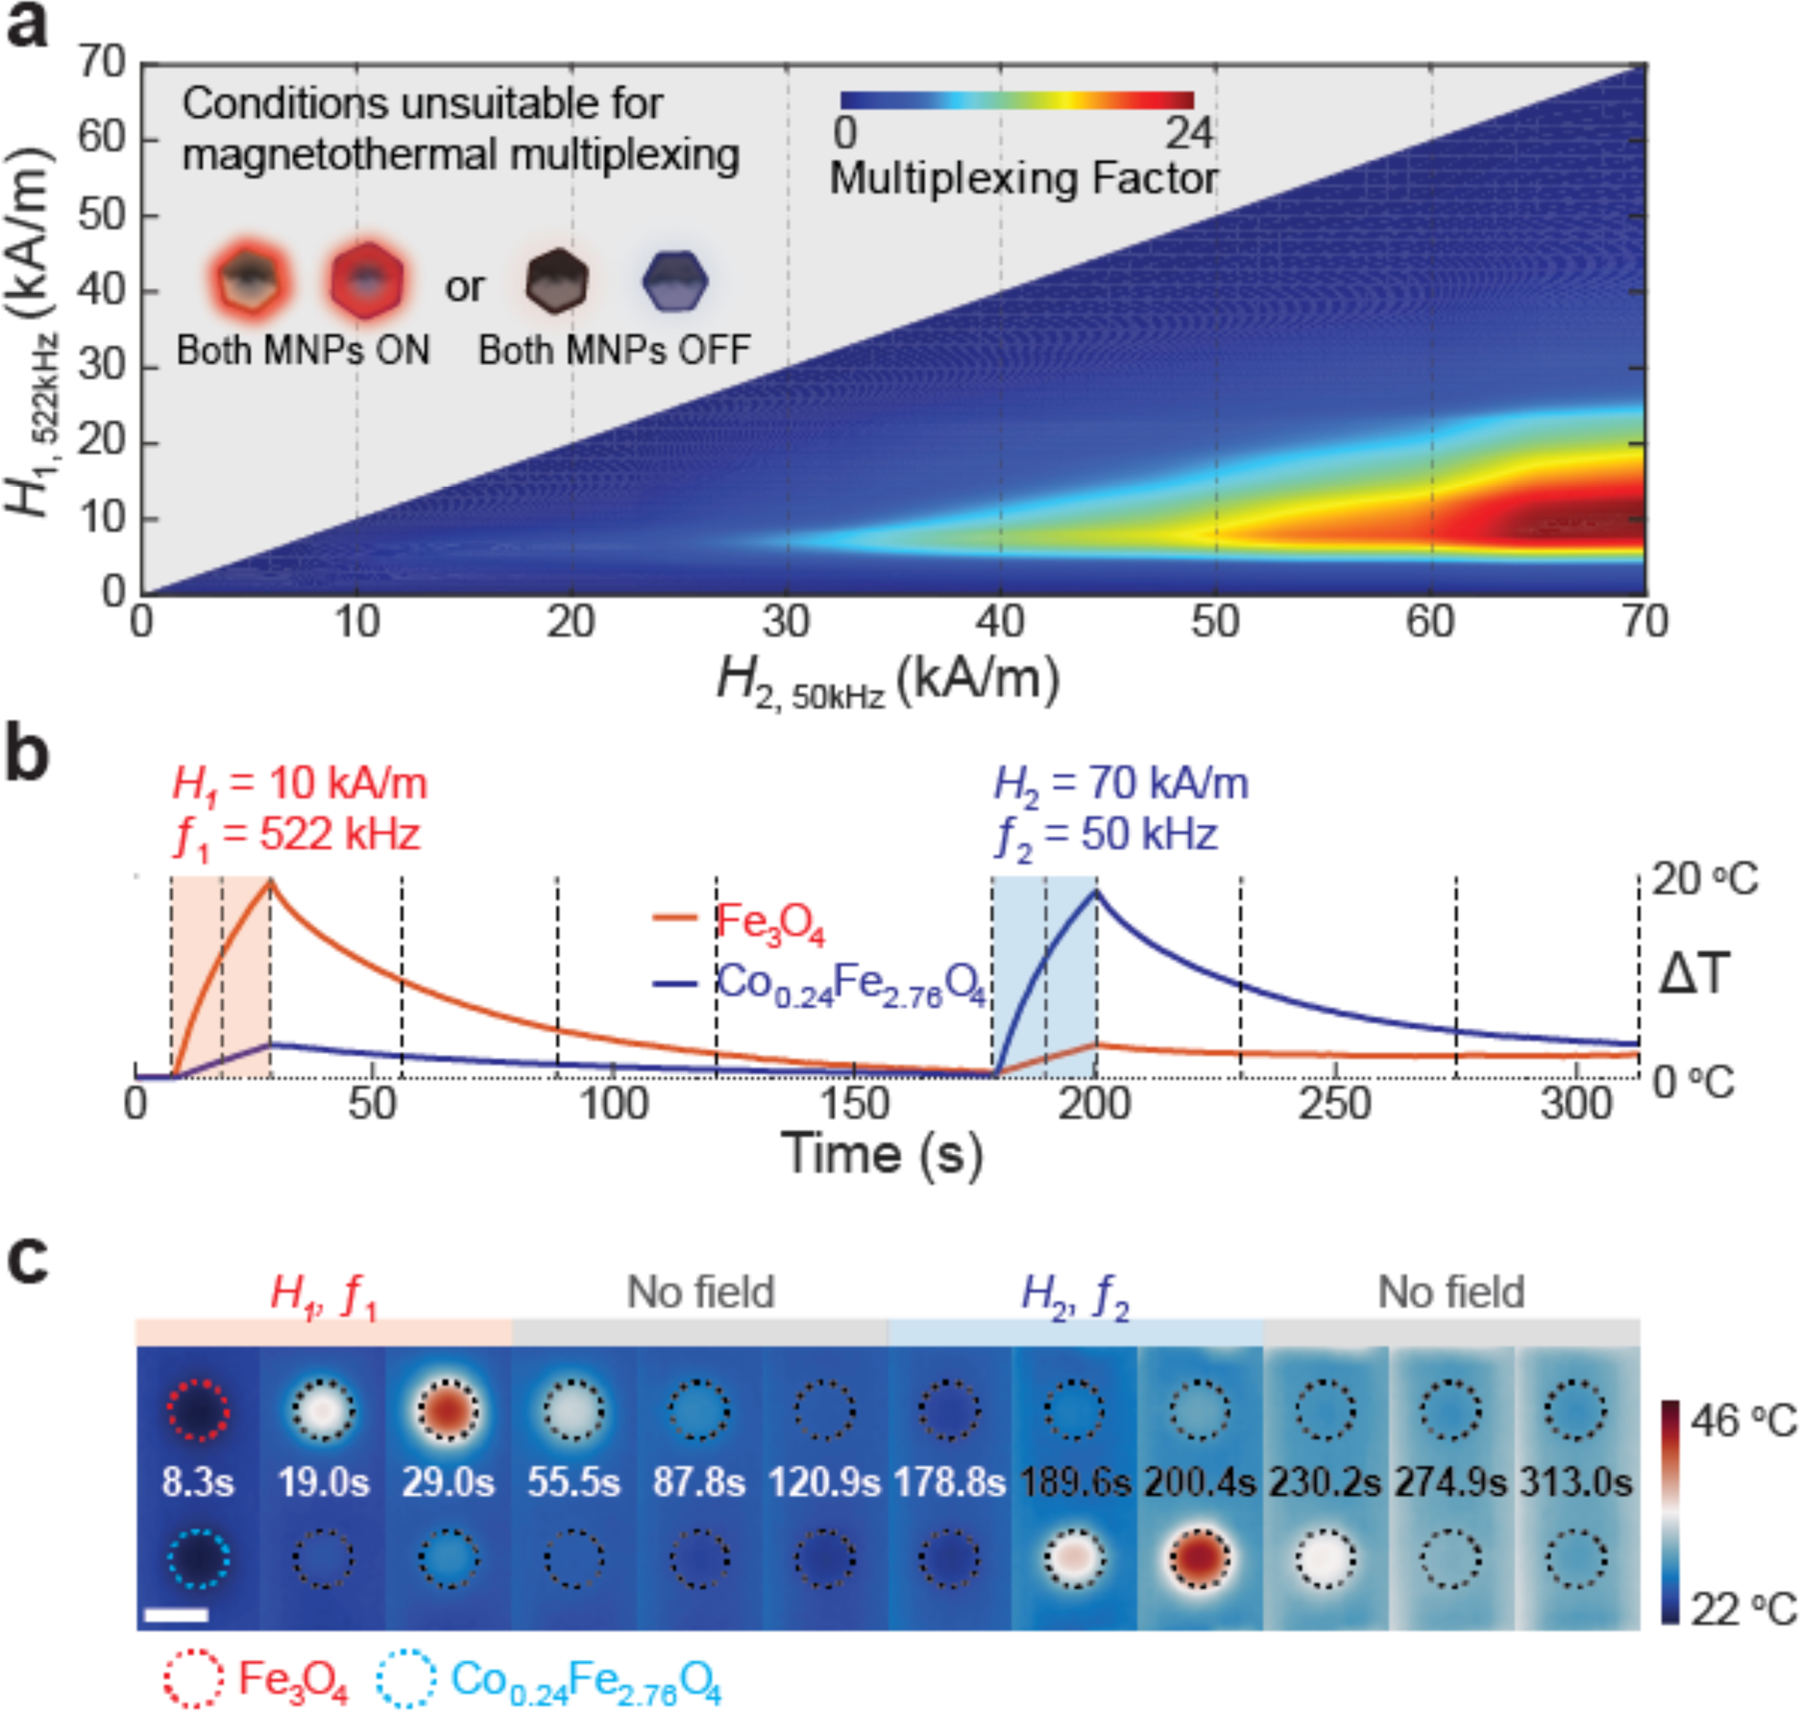
Figure 4.

Optimization of field conditions and thermographic verification for multiplexed thermal control (a) Multiplexing factor as a function of AMF amplitudes H1 and H2, for frequencies f1=522 kHz and f2=50 kHz. The grey area represents excluded conditions H1>H2; a pair of AMFs in which both the amplitude and frequency of one condition is higher than the other is unsuitable for magnetothermal multiplexing. (b) Temperature profiles and (c) Thermographic images of two 10 μl MNP solution droplets (Fe3O4 16.3 nm - red and Co0.24Fe2.76O4 18.6nm - blue) exposed sequentially to two distinct AMFs for 20 s (70 kA/m, 50 kHz and 10 kA/m, 522 kHz), at each time frame. Dashed lines in temperature profiles (b) represent the times of the thermographic frames in (c). (Scale bar = 5 mm)
