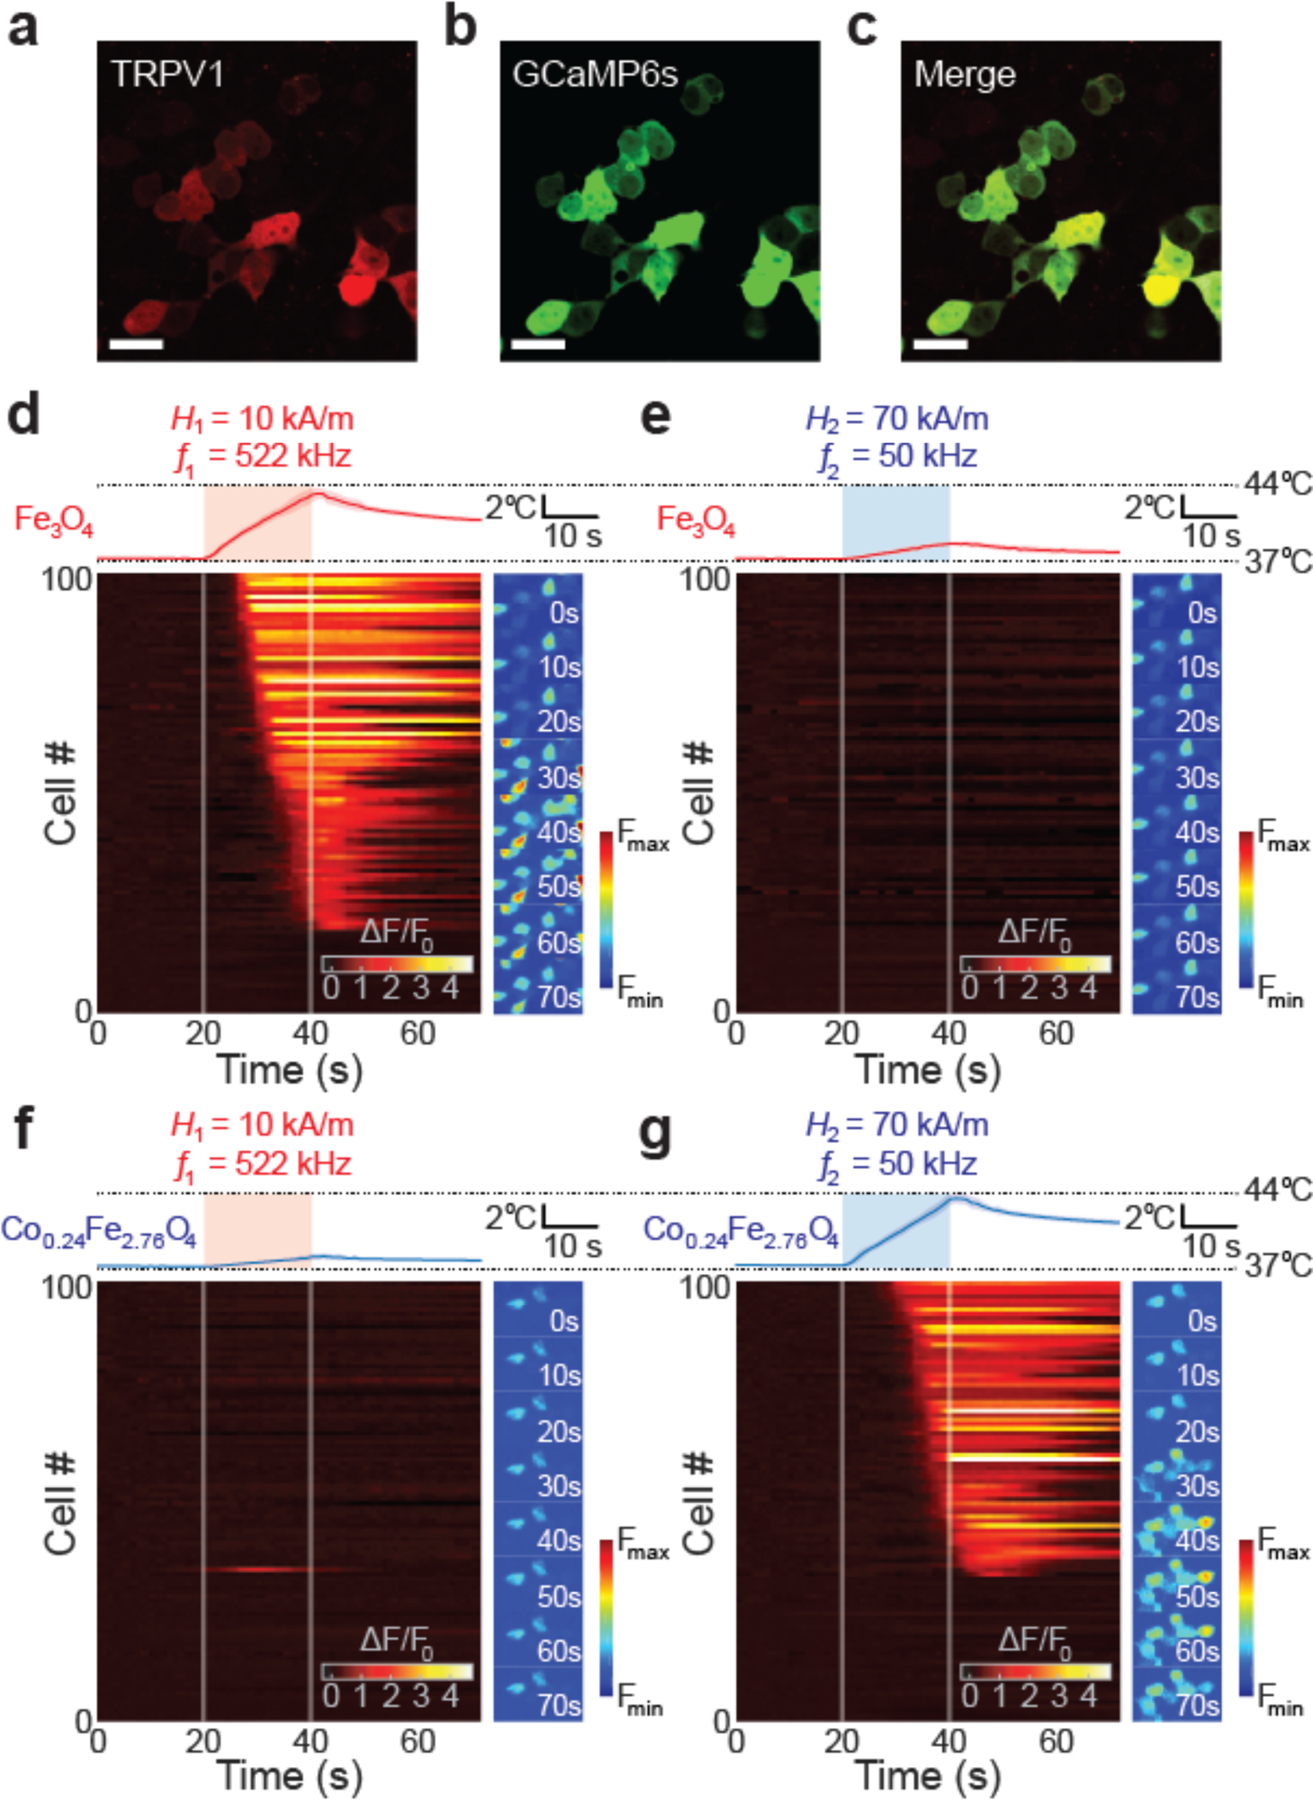
Figure 5.

Cellular responses selectively triggered by multiplexed magnetothermal control. (a-c) Confocal images of HEK293T cells co-transfected with both TRPV1-p2A-mCherry (a, c) cytoplasmic mCherry expression) and GCaMP6s (b, c). (Scale bar = 25 μm). (d-g) Cellular responses to multiplexed magnetothermal heating. Temperature profiles (upper plots) of the ferrofluids and the normalized GCaMP6s fluorescence ΔF/F0 (lower heat maps) of 100 randomly automatically chosen HEK239T cells plotted within the same time frame (0–70 s). Side panels indicate normalized GCaMP6s fluorescence images of the cells at different time-points during the experiments. (Scale bars = 40 μm). For each ferrofluid, the non-pairing AMF was applied at first. Afterward the same field of view (FOV) was imaged when cells were exposed to the pairing AMF. Each ΔF/F0 profile is from same FOV for each cover slip. AMFs were applied for 20 s (color boxes in temperature profiles and white lines in heat maps: from 20 s to 40 s). (d) Fe3O4 at 10 kA/m 522 kHz AMF. (e) Fe3O4 with 70 kA/m 50 kHz AMF. (f) Co0.24Fe2.76O4 with 10 kA/m 522 kHz AMF. (g) Co0.24Fe2.76O4 with 70 kA/m 50 kHz AMF.
