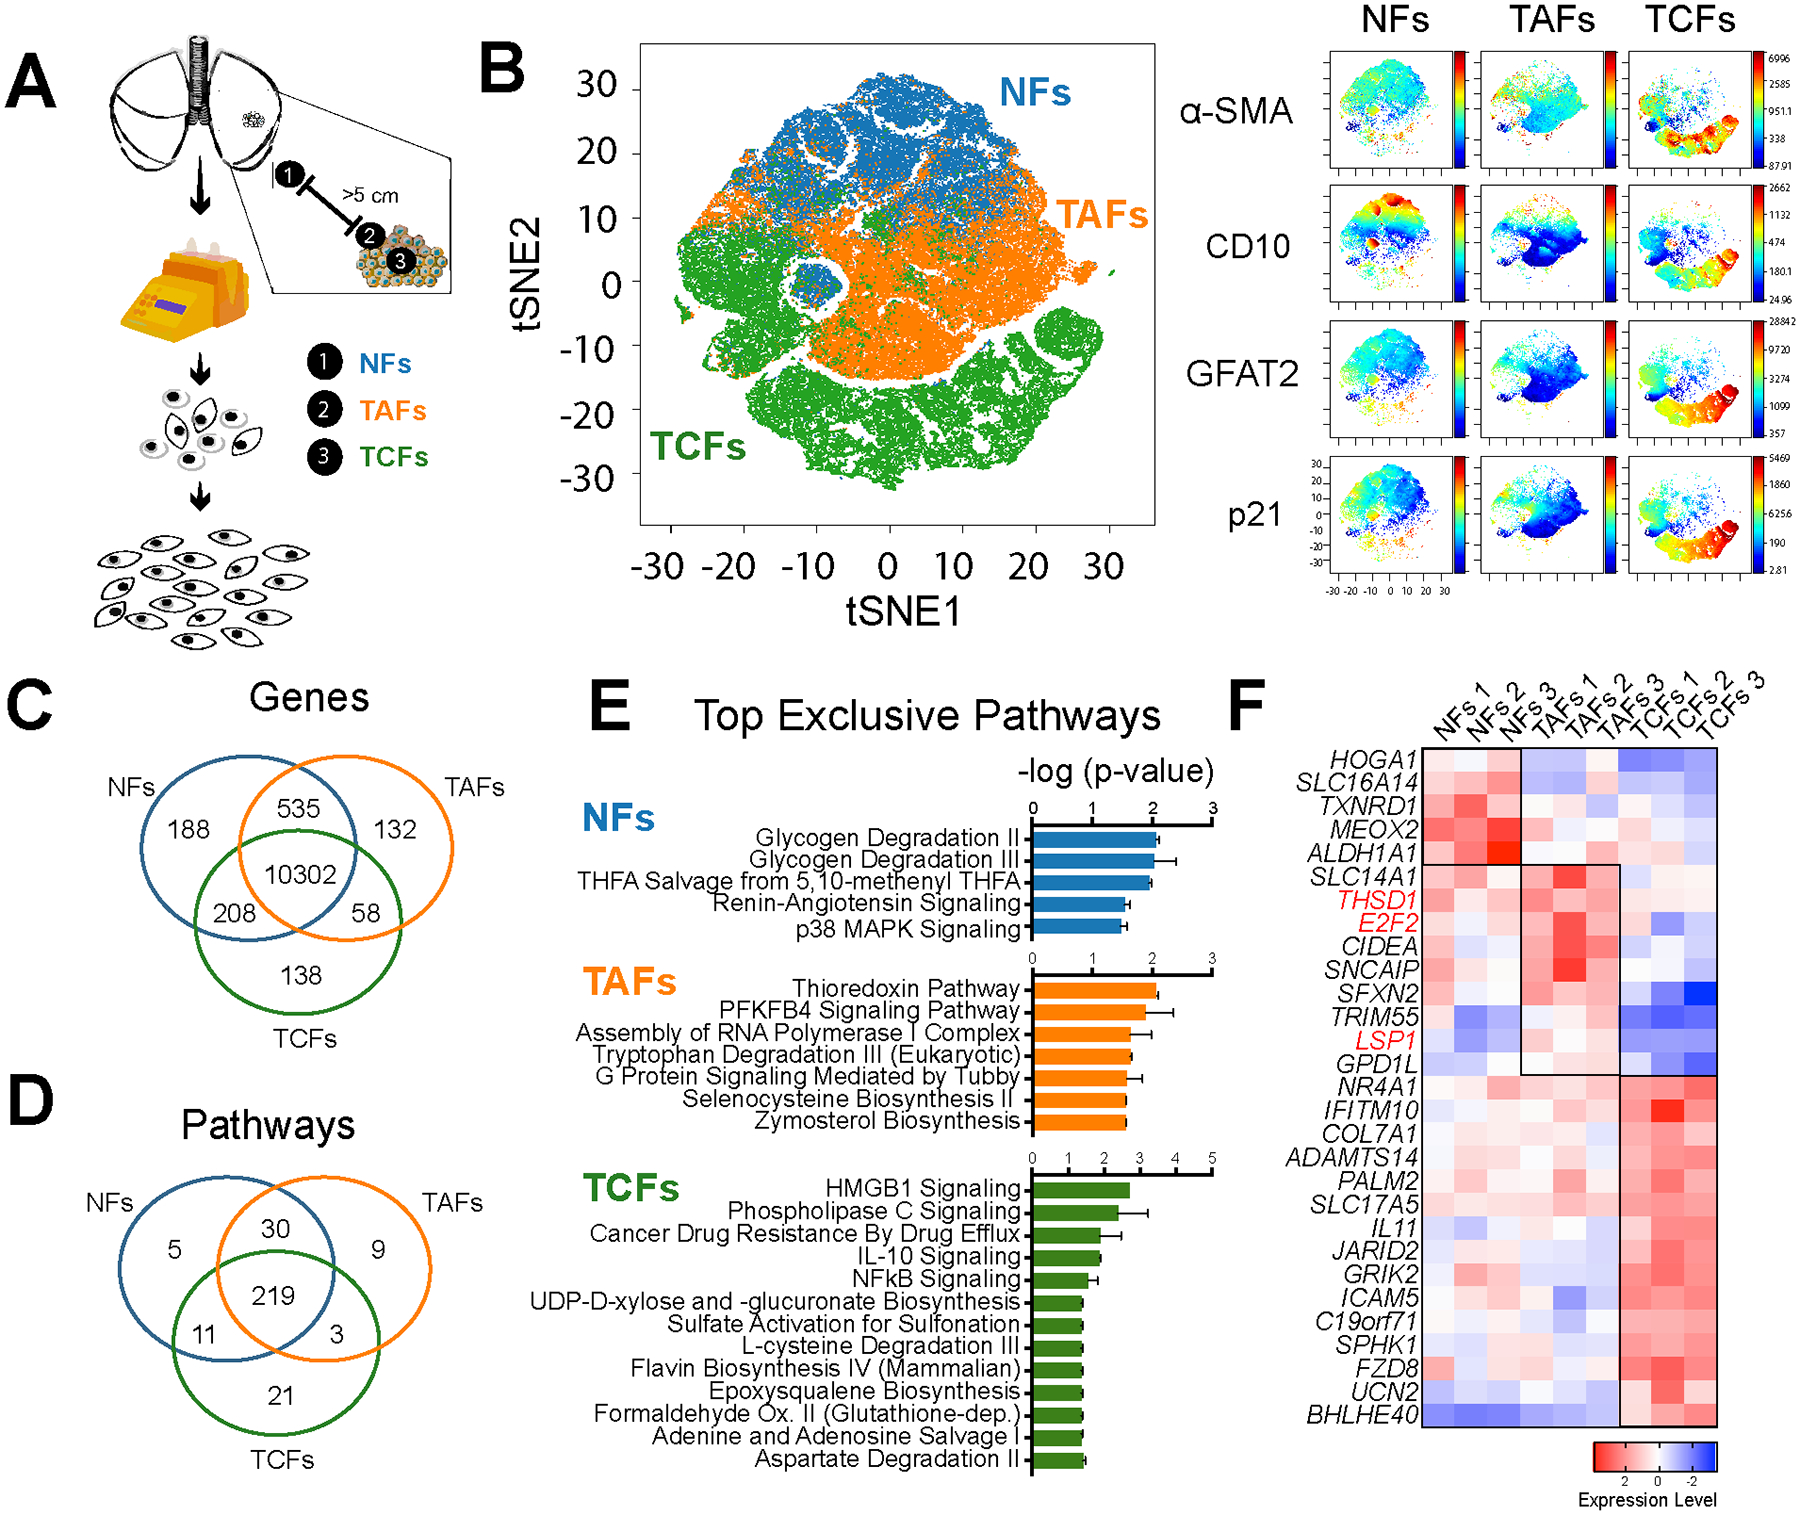
Figure 1. Analysis of LUAD fibroblasts derived from different tumor regions.

A, Fibroblast expansion workflow of LUAD fresh specimens. B, Phase contrast microscopy images of NFs, TAFs and TCFs. Specimen 2 is displayed here. C, Representative viSNE analysis of NFs, TAFs and TCFs, using α-SMA, FSP1, GFAT2, CD10, p21 and vimentin as clustering markers. Other biological replicates are available in Supplementary Fig. S1C. Venn diagram showing the gene overlap measured by RNAseq (TPM >1 in all biological replicates of each subtype). D, Venn diagram showing pathway overlap (E) and bar graph (F), showing the top exclusive pathways in NFs (n=3), TAFs (n=3) and TCFs (n=3), analyzed with Ingenuity Pathway Analysis software. G, Heatmap showing relative normalized gene expression of top DEGs in NFs, TAFs and TCFs.
