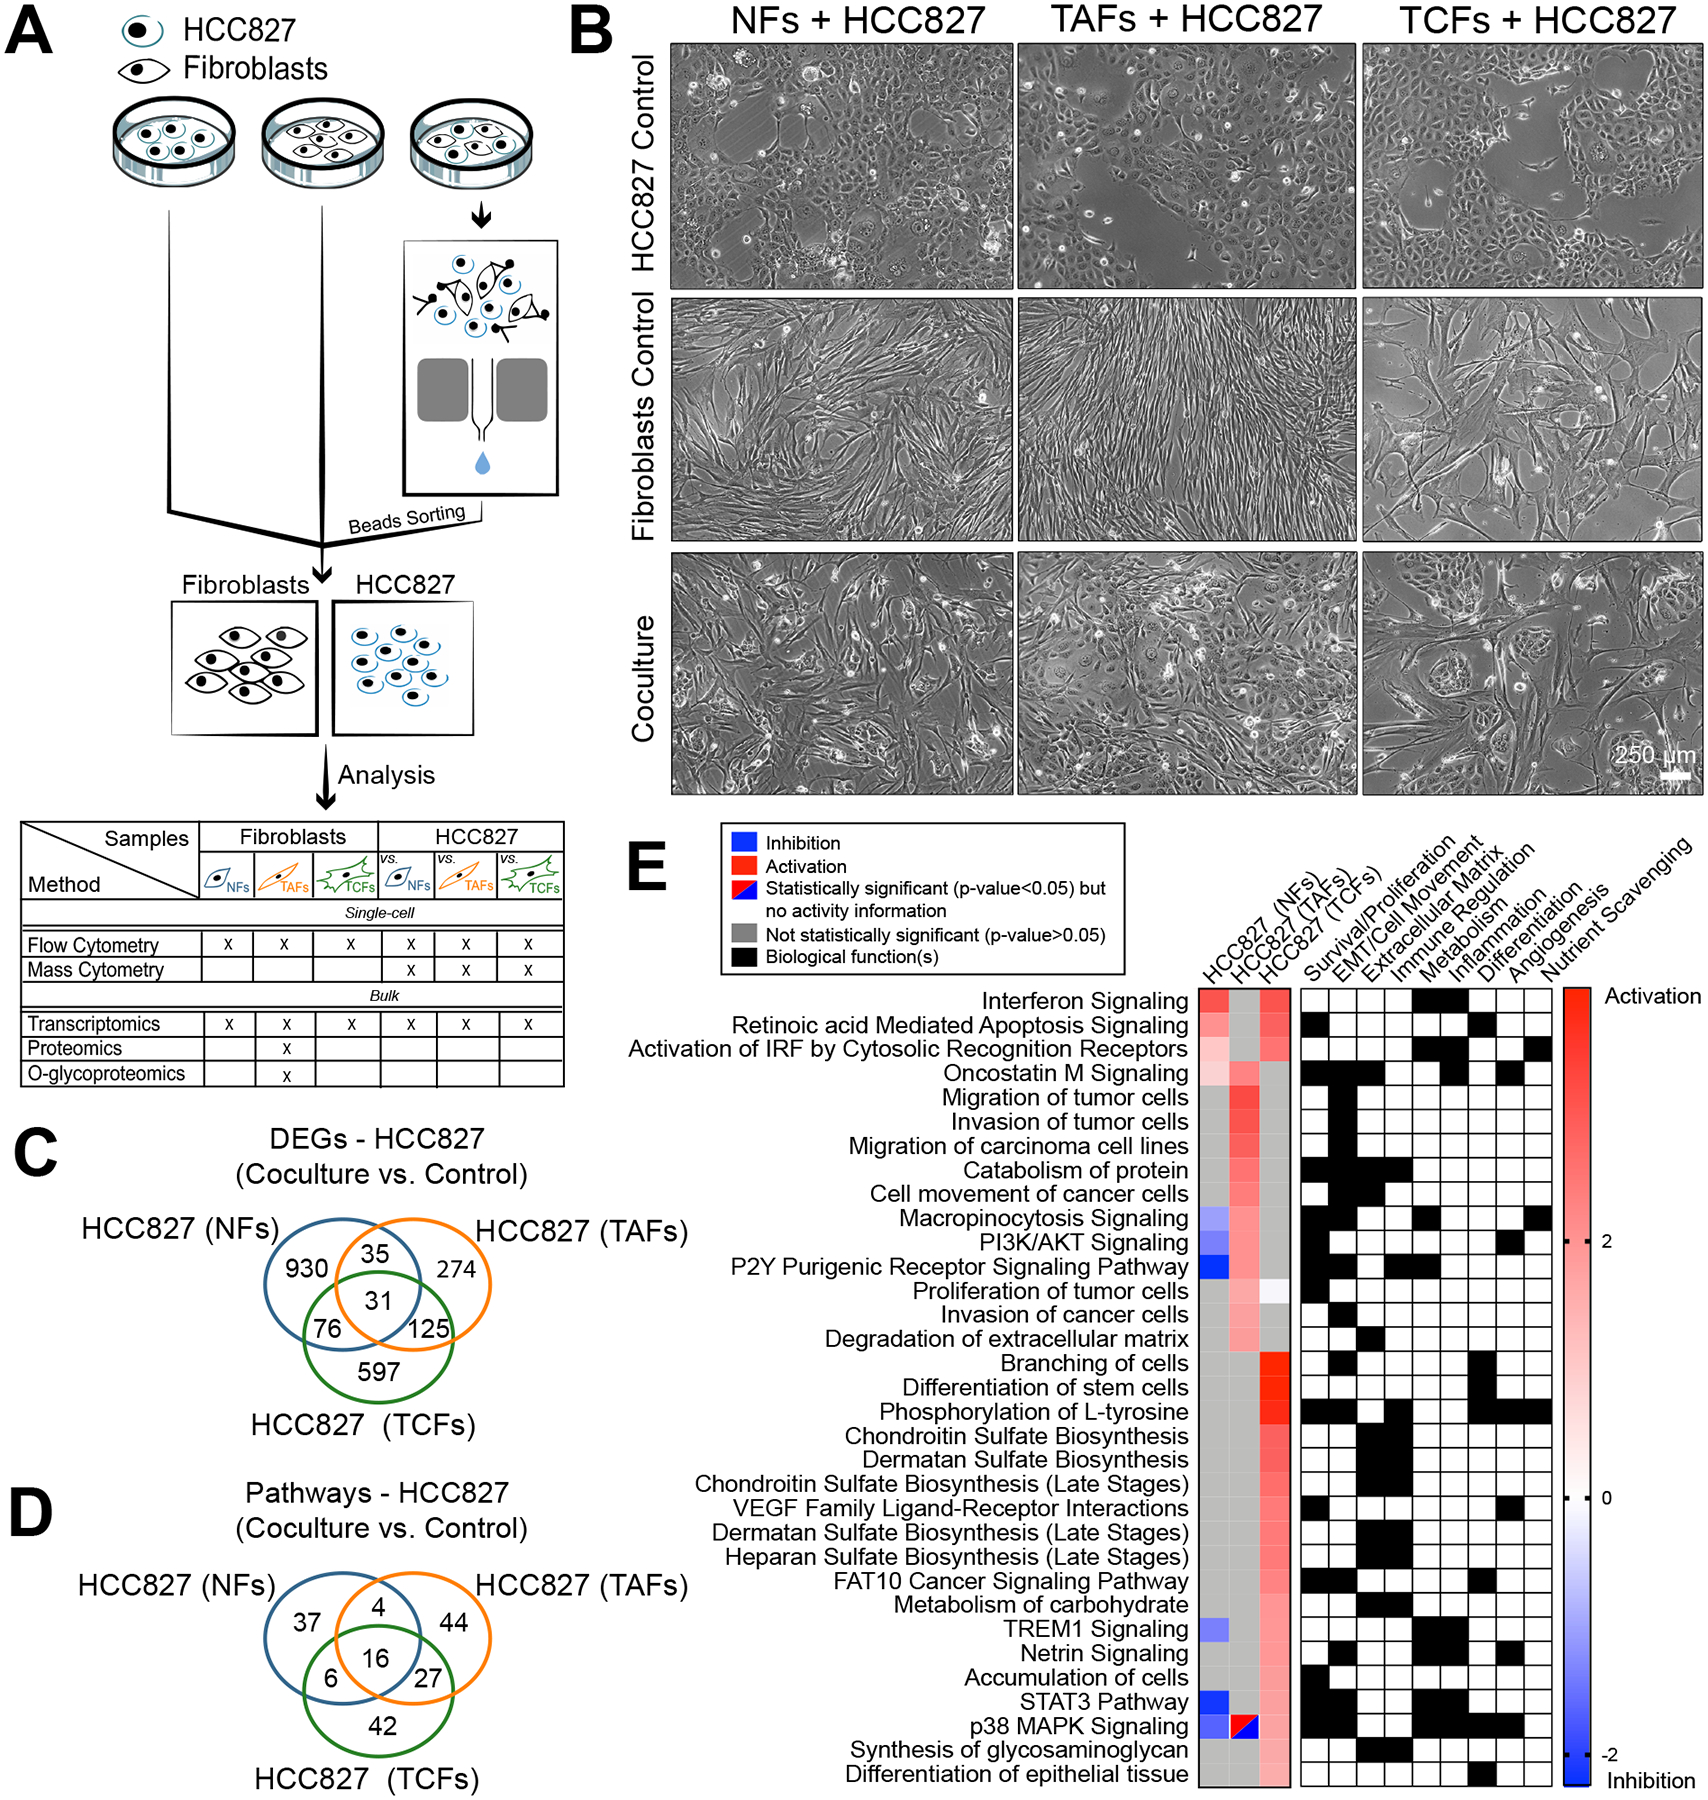
Figure 2. RNAseq analysis of HCC827 after coculture with NFs, TAFs and TCFs.

A, Coculture, cell separation and downstream analysis workflow. B, Phase contrast microscopy images of NFs, TAFs and TCFs cocultures from specimen 2 with HCC827 lung adenocarcinoma cell line. Biological replicates are available at Supplementary Fig. S2A. C, Venn diagram showing the gene overlap between HCC827 cocultures with NFs (n=3), TAFs (n=3) and TCFs (n=3) compared to their monoculture control measured by RNAseq (p < 0.05, fold-change > 0.5). Venn diagram showing the pathways overlap and (D), heatmap showing the main pathways/biological functions differences between HCC827 cocultures with NFs (n=3), TAFs (n=3) and TCFs (n=3) compared to their monoculture control (E) analyzed with the IPA software.
