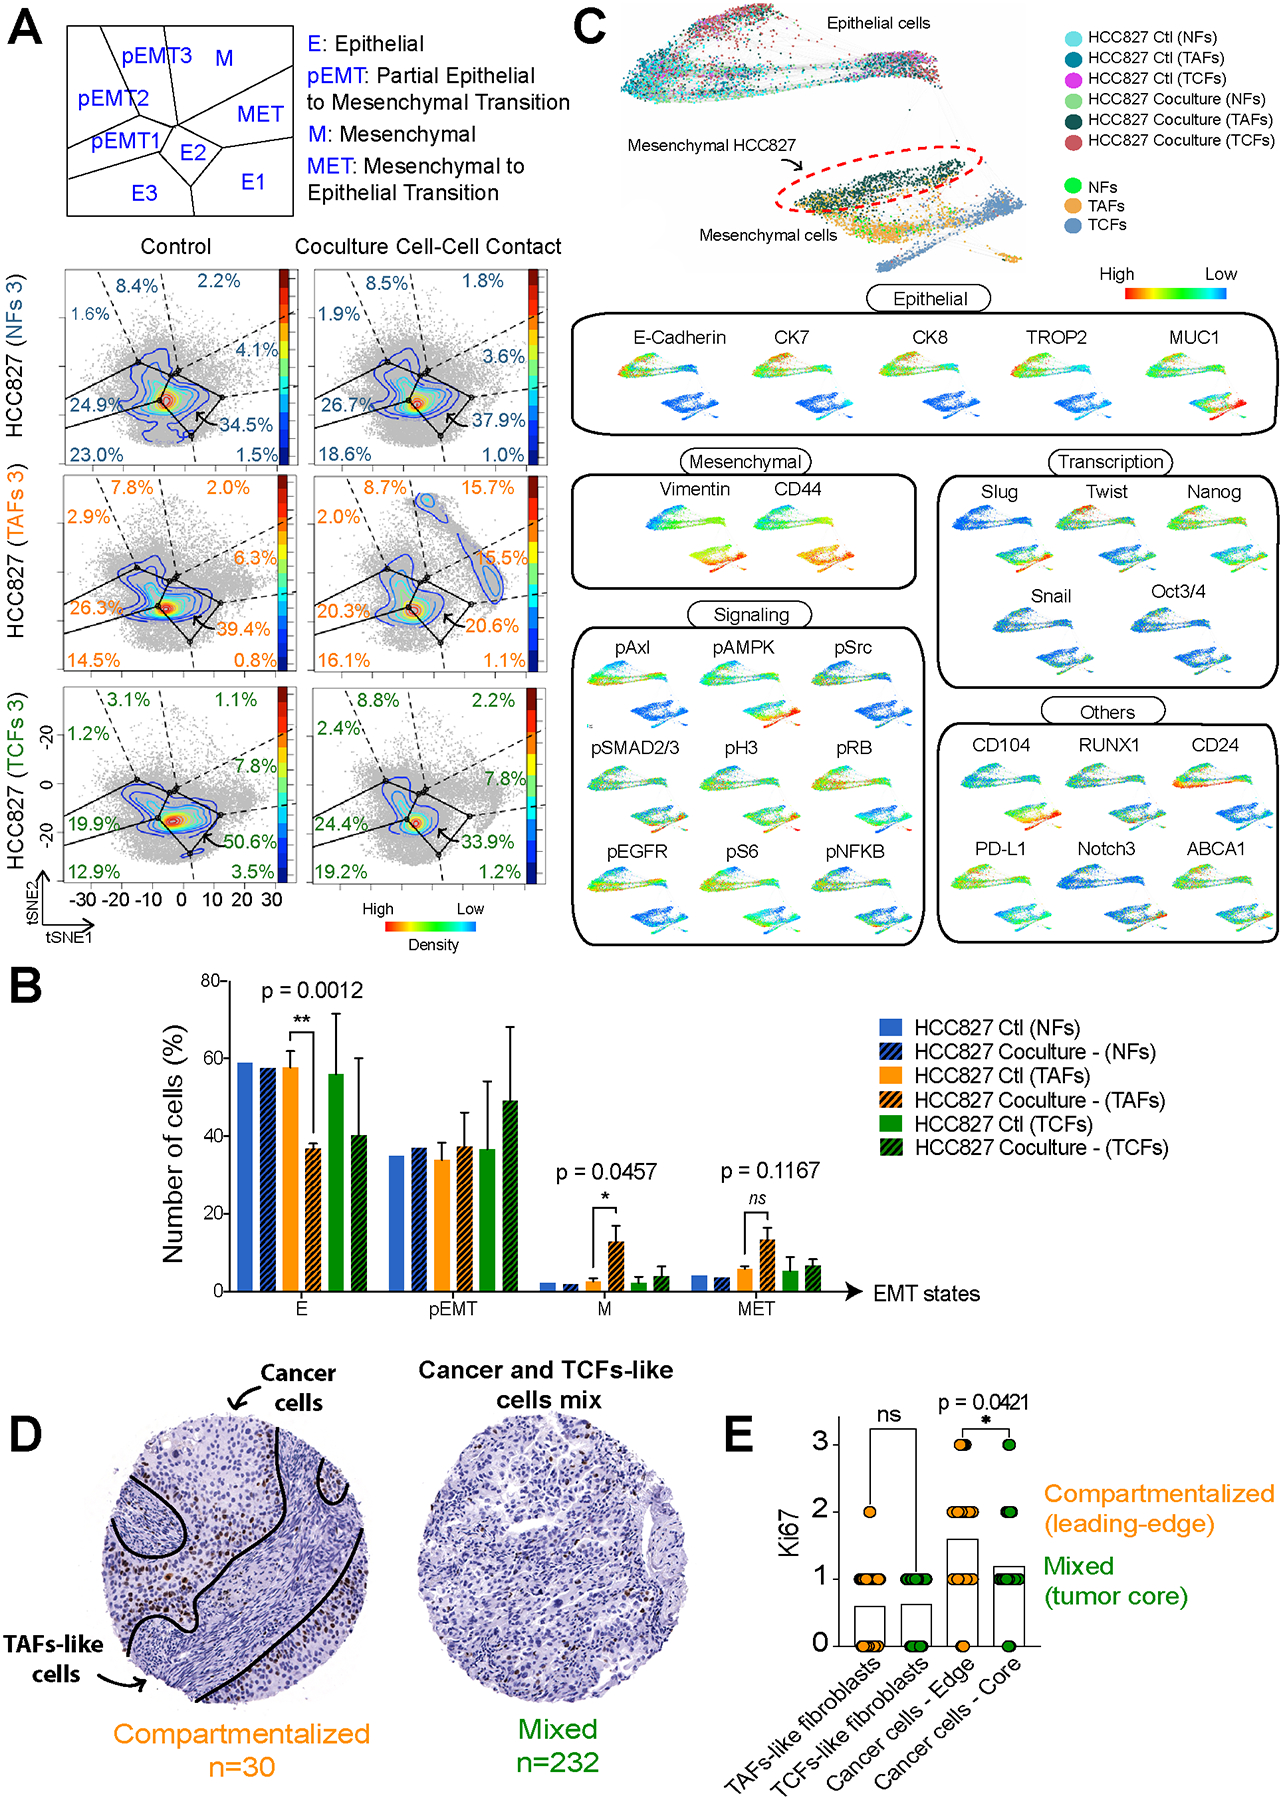
Figure 3. CyTOF analysis of HCC827 after coculture with NFs, TAFs and TCFs.

Projections of the HCC827 monoculture controls and matched cocultures after cell-cell contact with NFs, TAFs and TCFs onto the EMT–MET PHENOSTAMP phenotypic map (A) and bar graph quantification (B) of the number of cells in each region of the map. C, Single-cell force-directed layout colored by protein expression of indicated markers of HCC827 cocultures with NFs, TAFs and TCFs using X-shift clustering (arcsinh transformed data of specimen 3). See Supplementary Fig. S3C for expression scale bars and S3D and S3E for biological replicates. D, IHC representative examples of LUAD specimens from the lung TMA showing compartmentalized and mixed samples and (E) Ki67 quantification of fibroblasts and cancer cells.
