
Figure 4. Gene expression analysis of NFs, TAFs and TCFs after coculture with HCC827 lung adenocarcinoma cancer cells.
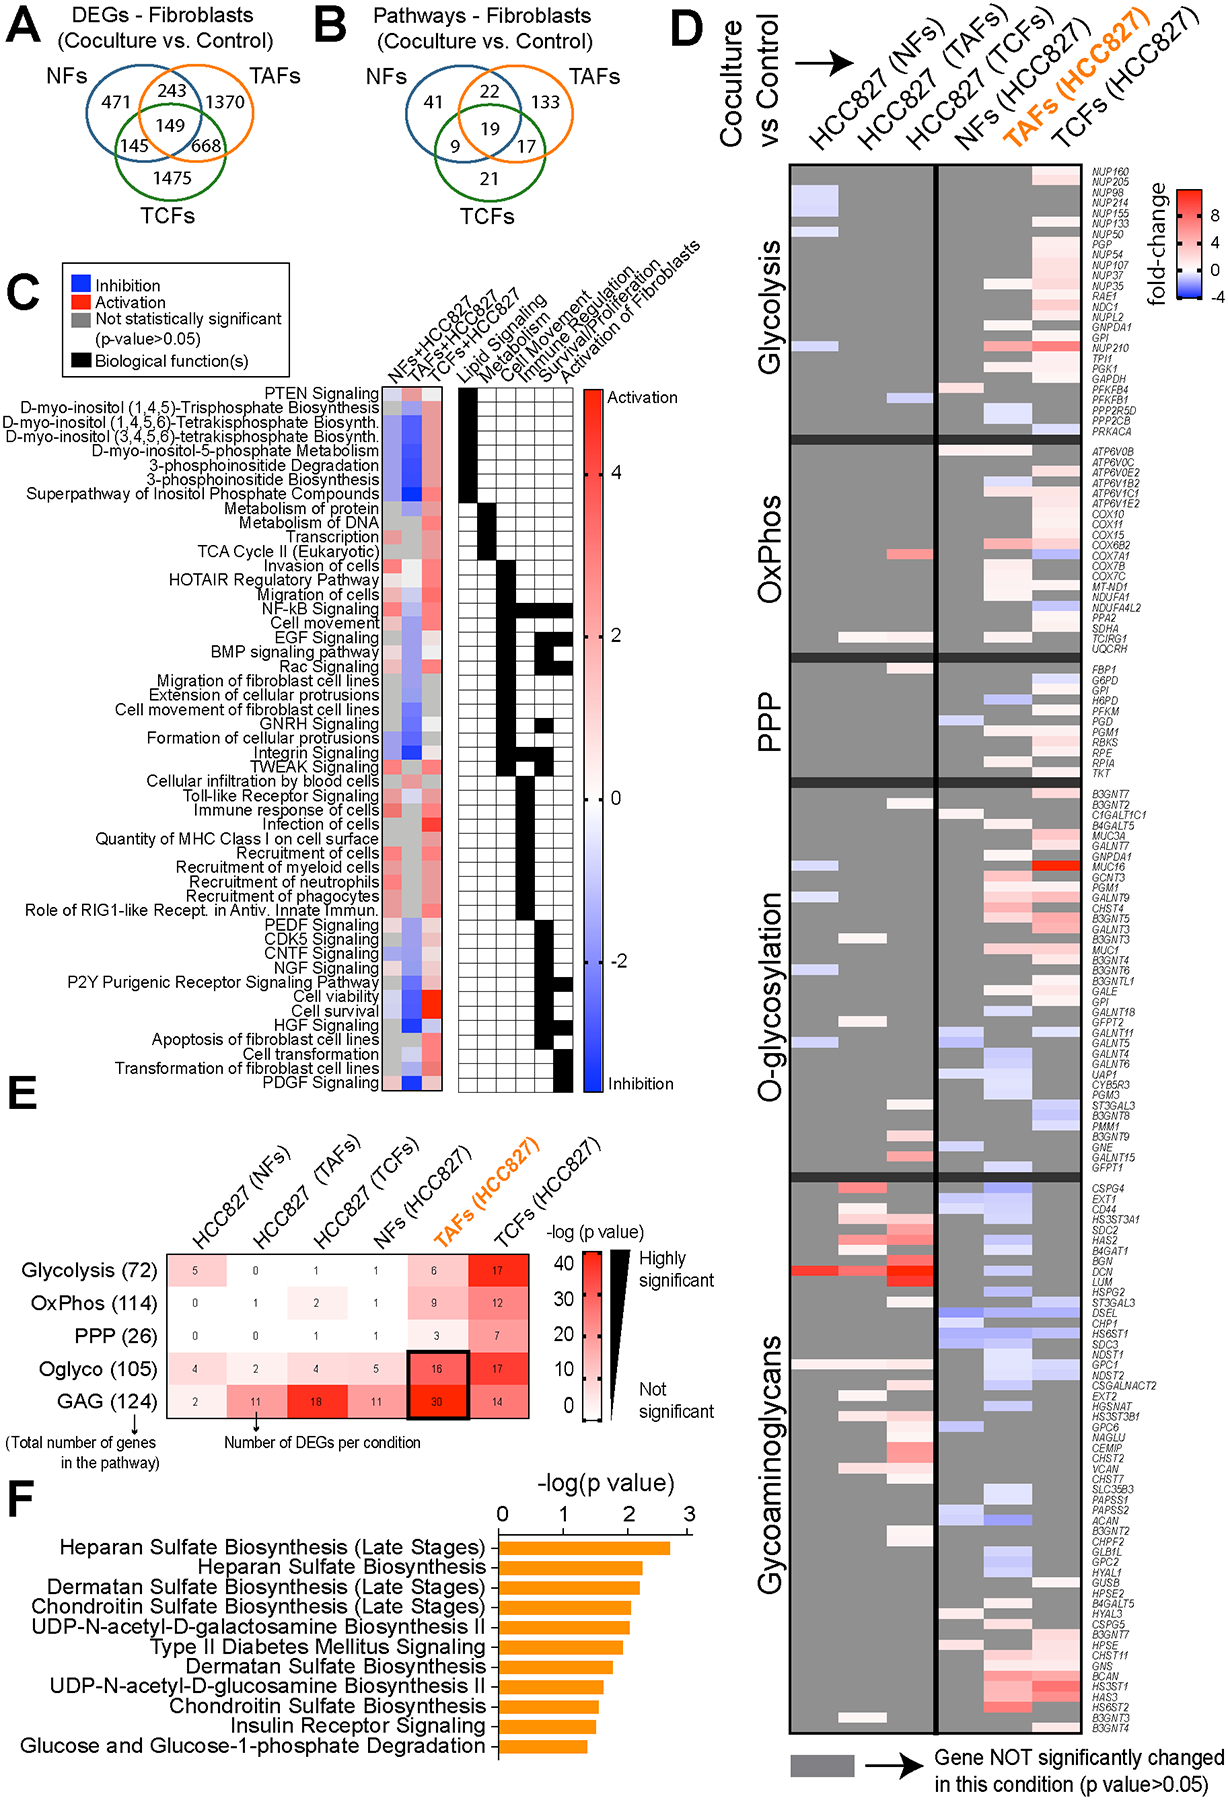
A, Venn diagram showing the gene overlap between NFs (n=3), TAFs (n=3) and TCFs (n=3) cocultures with HCC827 compared to their monoculture control measured by RNAseq analysis (p < 0.05, fold-change > 0.5). Venn diagram showing pathway overlap (B), heatmap showing the main pathways/biological functions differences analyzed with the IPA software (C) and heatmap showing the fold-change of DEGs in the main glucose metabolic pathways between NFs (n=3), TAFs (n=3) and TCFs (n=3) cocultures with HCC827, (D) and heatmap showcasing the number of overlap genes between DEGs in each condition and within each metabolic pathway (E). Color of heatmap represents -log(p-value) of the gene overlap calculated using a hypergeometric test. The numbers in parentheses show the total number of genes from each MSigDB gene set and tile numbers show the number of DEGs for each condition. See p values at Supplementary Fig. S4G. F, Bar graph showing exclusive pathways related to glycans biosynthesis enriched in TAFs cocultures compared to their monoculture control and analyzed with the IPA software.