
Figure 5. Crosstalk with HCC827 alters the TAFs O-glycoproteome.
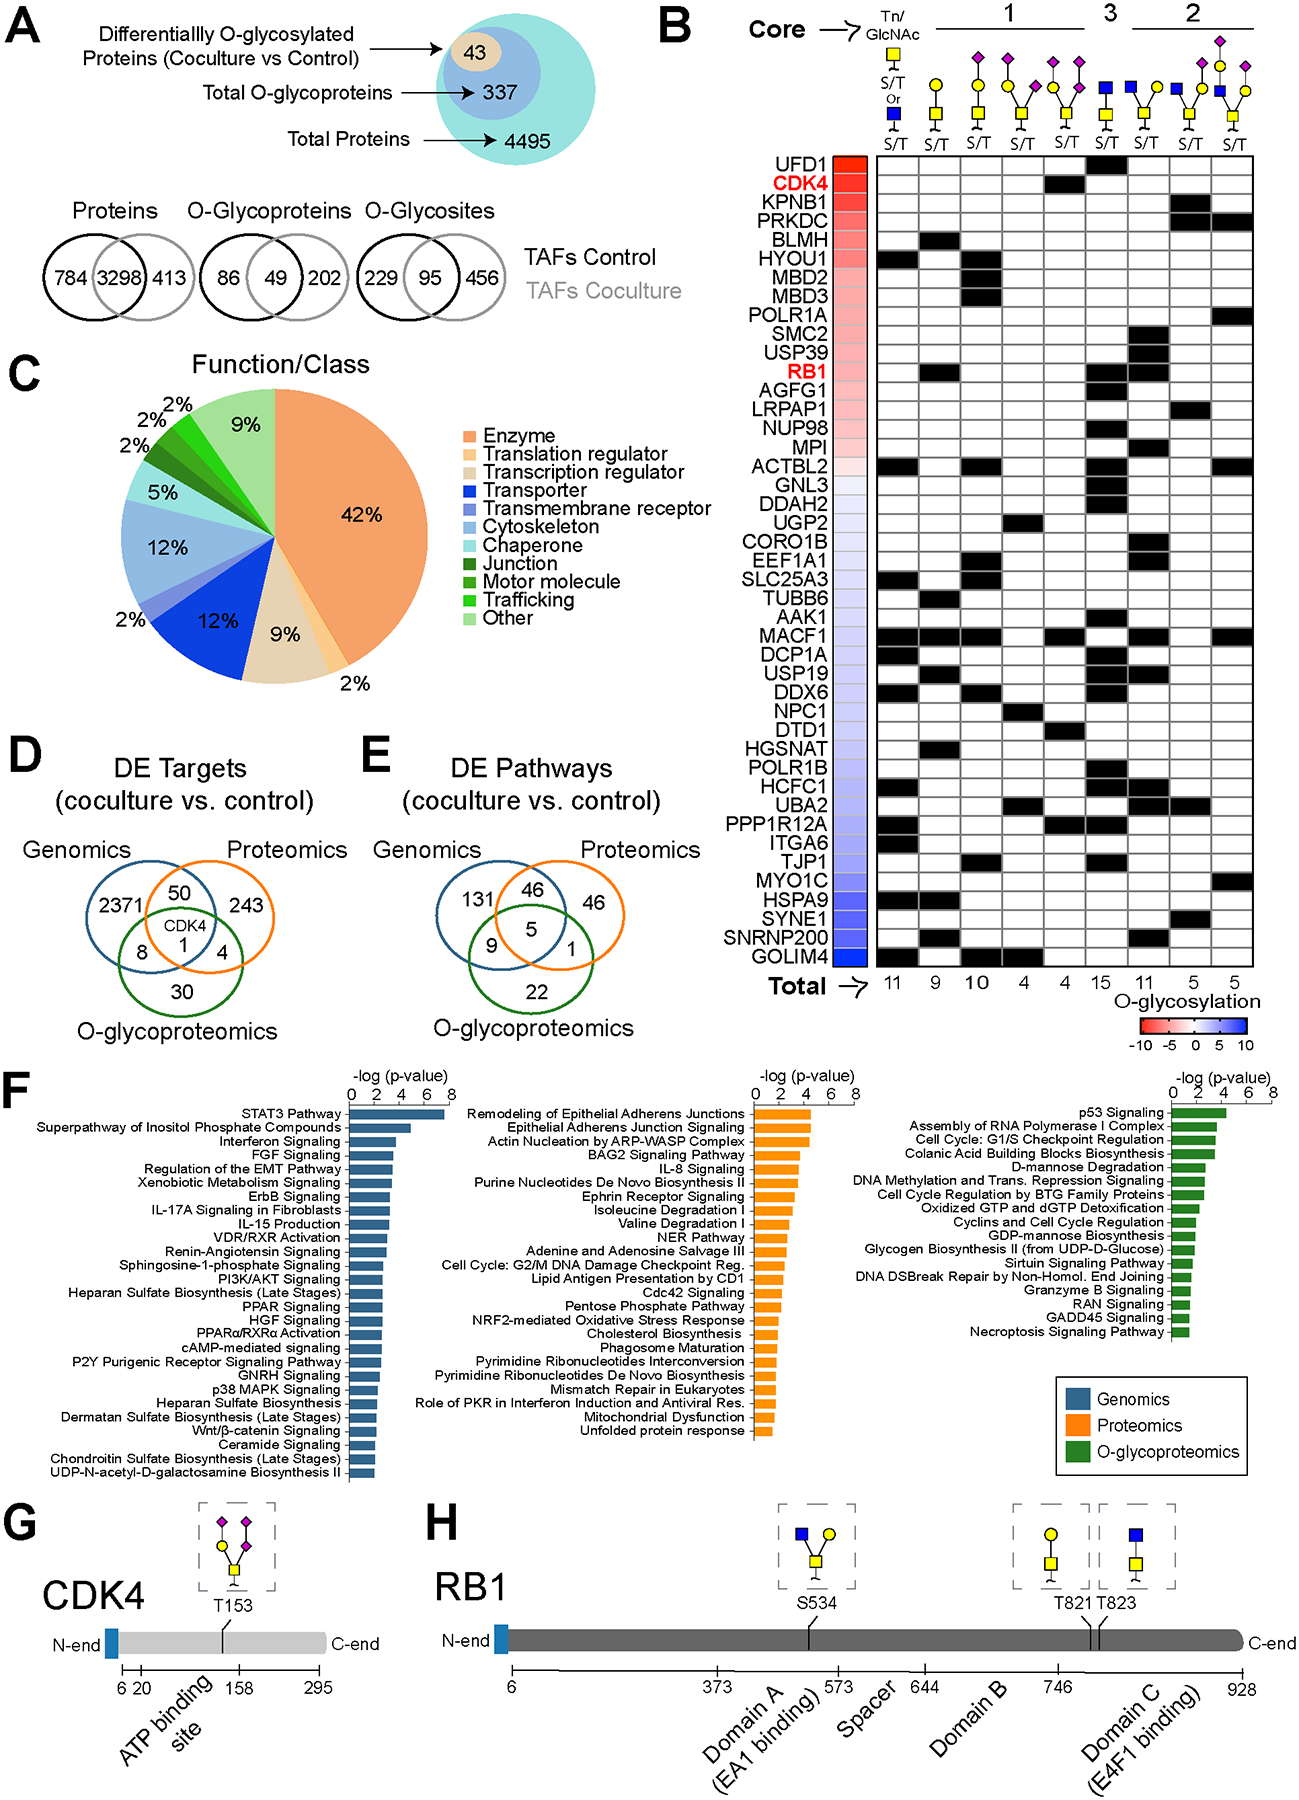
A, Venn diagram showing proteins, O-glycoproteins and O-glycosites found in TAFs monocultures and cocultures analyzed by mass spectrometry. B, Pie charts showing the main classes of the differentially O-glycosylated proteins after coculture identified by mass spectrometry. C, Heat map and summary table of the differentially O-glycosylated proteins and glycan heterogeneity after coculture with HCC827. Venn Diagram showing the overlap of targets (D) and the DE pathways identified in TAFs cocultures (relative to control monoculture) (E) using different methods of analysis. F, Bar graph highlighting a sample of the top enriched pathways in TAFs cocultures at the genomic, proteomic and O-glycoproteomic levels. CDK4 (G) and RB1 (H) protein domains and O-glycan positions.