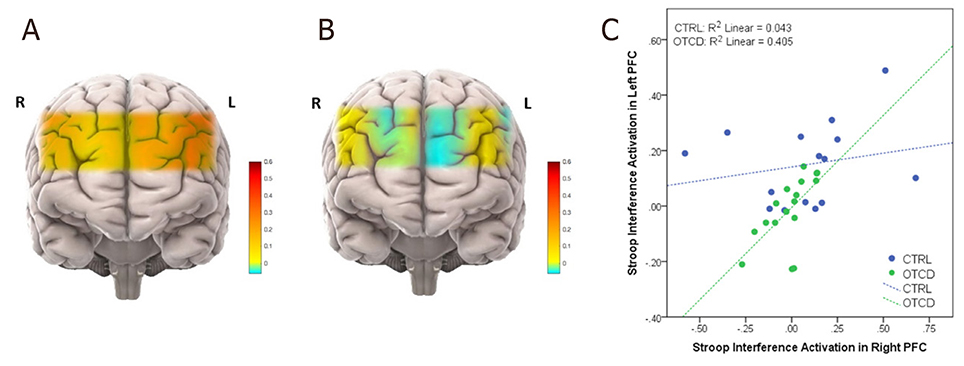
Figure 4.
Activation maps in subjects with OTCD and controls. Prefrontal cortex activation in control (A) vs. OTCD cohorts indicating the lower activation during the Stroop task in OTCD group (B); stroop interference activaton in left prefrontal cortex of controls and subjects with OTCD (C). OTCD: ornithine transcarbamylase deficiency

