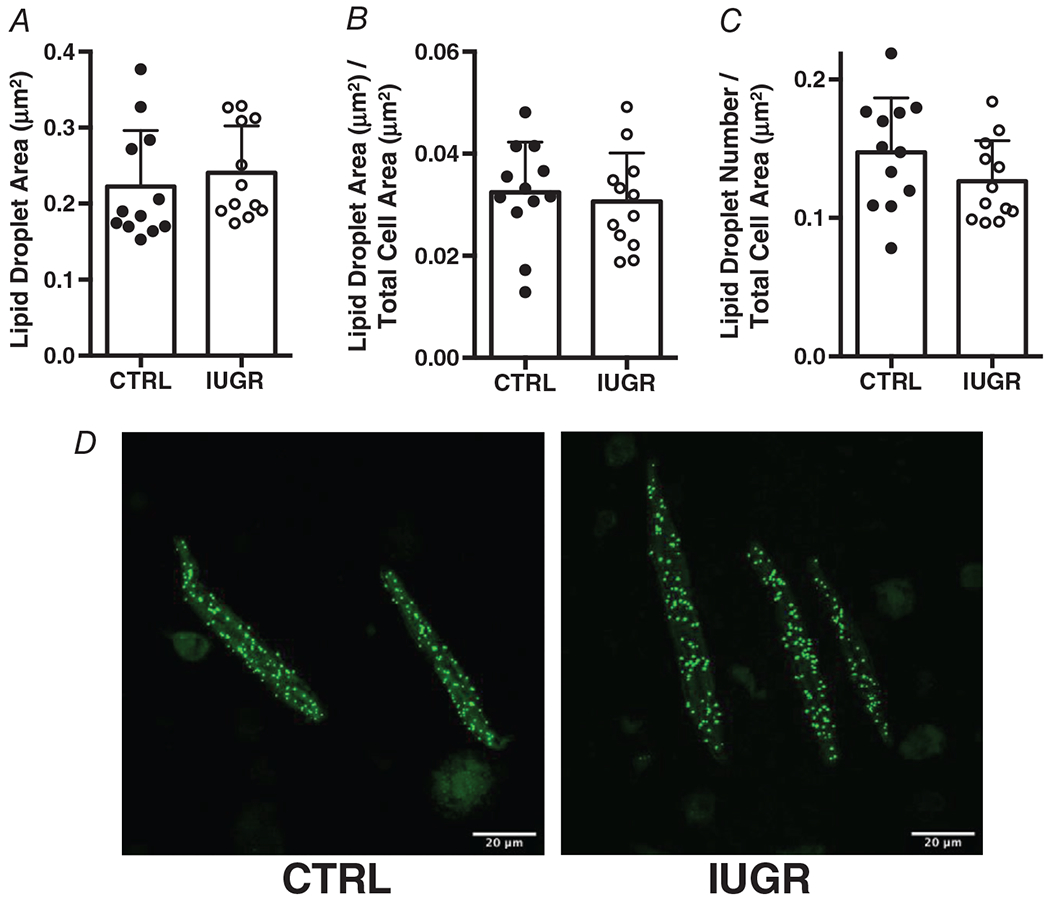
Figure 3. Intrauterine growth-restricted. (IUGR) and control cardiomyocytes do not differ in their formation of lipid droplets.

A, lipid droplet size, P = 0.521. B, lipid droplet size relative to cell size, P = 0.654. C, number of lipid droplets relative to cell size, P = 0.154. n = 12 control, n = 12 IUGR. Means ± SD. D, Images are representative lipid droplets from control and IUGR heart.
