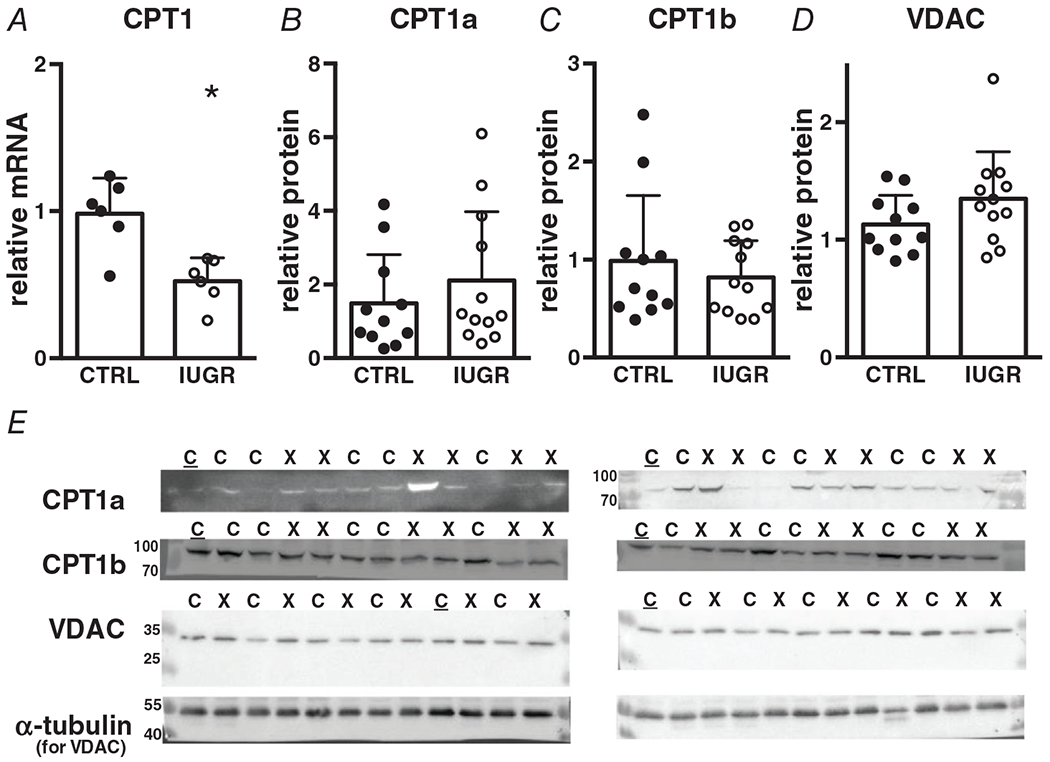
Figure 6. Gene (relative to RPL37a) and protein (relative to total protein or alpha-tubulin) expression of mitochondrial transporters in growth-restricted myocardium.

mRNA: n = 6 control, n = 6 IUGR (CPT1 P = 0.0029), protein: n = 11 control, n = 12 IUGR (CPT1a P = 0.375, CPT1b P = 0.462, VDAC P = 0.134). Means ± SD, *P < 0.05. In E: C = Control, X = IUGR, C = Calibrator Control. Numbers adjacent to ladder represent kDa.
