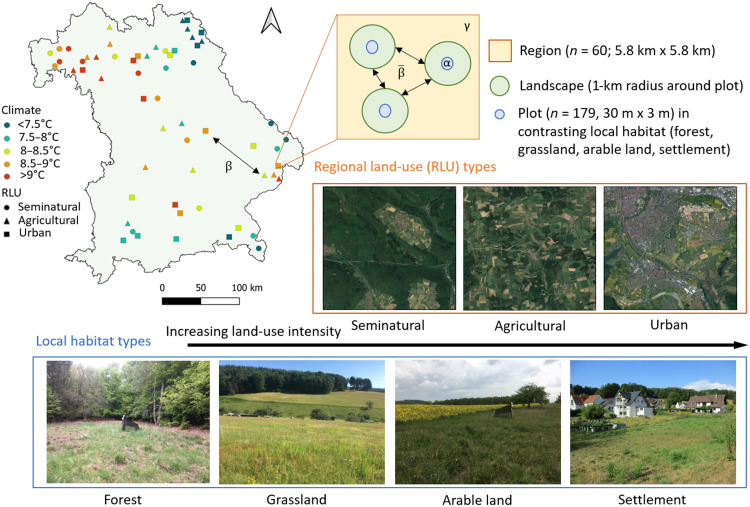
Fig. 1. Location and overview of the study sites and study design.
Symbols in the map (Bavaria, Germany) represent our 60 study regions selected along gradients of climate (multiannual mean air temperature 1981–2010) and land-use intensity [seminatural, agricultural, and urban regions—regional land use (RLU)]. Each region contains three plots in open herbaceous vegetation, located in three dominating out of four possible habitat types—forest, grassland, arable land, and settlement. We use the regional scale for analysis of the gamma (γ), intraregional () and interregional (β) beta diversity, and the local (plot) and landscape (1-km radius around plot) scales for analysis of the alpha (α) diversity. Aerial pictures of regional land-use types were obtained from Google Earth. Photo credit: Cristina Ganuza, Julius-Maximilians-University Würzburg.

