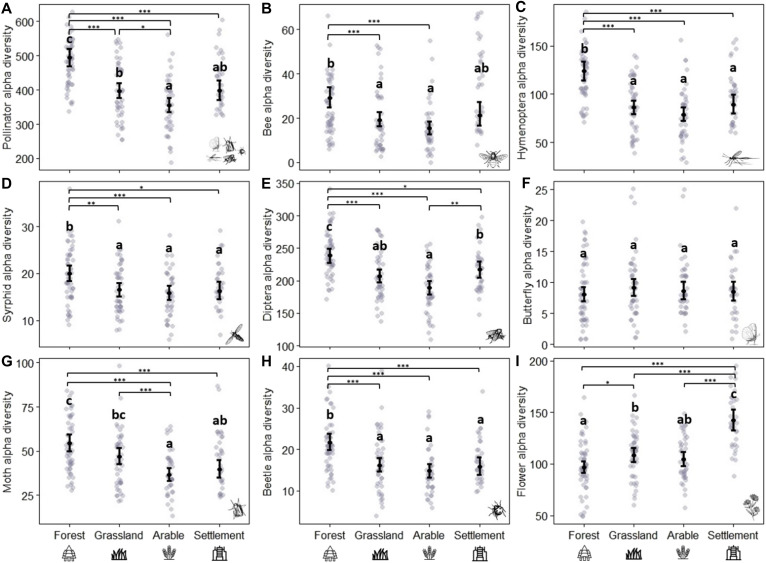
Fig. 4. Differences in alpha diversity of pollinator and flowering-plant communities in the four local habitat types.
Graphs show predictions from the best models (Table 1C), while butterfly alpha diversity and flowering-plant alpha diversity models include habitat as the only explanatory variable. Differences among habitats were calculated via Tukey post hoc tests [function glht from the multcomp package (80)]. Black points indicate means, and bars indicate 95% confidence intervals, while gray points show the raw data. The different panels show (A) whole pollinator community, (B) bees, (C) non-bee Hymenoptera, (D) syrphids, (E) non-syrphid Diptera, (F) butterflies, (G) moths, (H) beetles, and (I) flowering plants. Forest: n = 54, grassland: n = 46, arable land: n = 41, settlement: n = 34. Significance levels: ***P < 0.001, **P < 0.01, and *P < 0.05.

