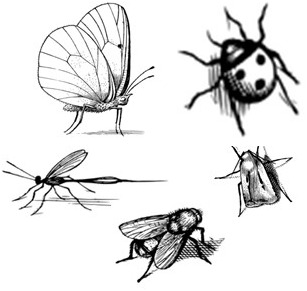
Table 1. Standardized z or t values of best models explaining (A) gamma, (B) intraregional beta, and (C) alpha diversity of pollinators.
Only explanatory variables that were included in the final models are shown. (A) Full gamma and (B) beta diversity models included the multiannual mean temperature [MAT] and precipitation [MAP] at the regional scale (5.8 km × 5.8 km), the land-cover proportion of forest [For], grassland [Gra], agriculture [Agr], and urban [Urb] in the region, and the gamma or beta diversity of flowering-plant communities [Flower γ or β], as well as the interaction between MAT and MAP and MAT and regional land-use covers. (C) Full alpha diversity models included the seasonal mean temperature recorded in the plot [T] in interaction with the local habitat type as factor with four levels (forest, grassland, arable land, and settlement) [Hab], the proportion of forest [For], grassland [Gra], agriculture [Agr], and urban [Urb] in the landscape (1-km radius around plot), the Shannon index of landscape diversity [Shannon], edge density describing landscape configuration [EdgeD], and the alpha diversity of flowering-plant communities [Flower α]. Because some variables were correlated or caused multicollinearity issues, different full models had to be fitted and compared (see Materials and Methods and fig. S8). Z [from GLMs (gamma diversity) and GLMMs (alpha diversity)] and t [from LMs (beta diversity)] values were standardized to allow comparison among variables of the different gamma, beta, and alpha diversity models. ΔAICnull indicate the difference in AIC between the best model and the null model.

|

|

|

|

|

|

|

|
|||
| A | γ Diversity | Pollinators | Bees | Hymenoptera | Syrphids | Diptera | Butterflies | Moths | Beetles | |
| Climate (Cl) | MATRegion | 4.52 | −0.20 | 2.66 | ||||||
| MAPRegion | −0.30 | 3.78 | 3.98 | −1.93 | −4.14 | |||||
| MAP:MATR | −3.71 | −3.43 | ||||||||
| Land use (LU) | ForRegion | 2.37 | 2.36 | −0.14 | 3.25 | |||||
| Cl:LU | For:MATR | 4.24 | ||||||||
| Nagelkerke’s R2 | 0.132 | 0.611 | 0.131 | 0.299 | 0.322 | 0.395 | 0.340 | 0.307 | ||
| ΔAICnull | 3.3 | 25.5 | 3.2 | 11.7 | 12.0 | 7.8 | 13.0 | 9.2 | ||
| B | β Diversity | Pollinators | Bees | Hymenoptera | Syrphids | Diptera | Butterflies | Moths | Beetles | |
| Climate (Cl) | MATRegion | −1.79 | −1.83 | −3.57 | −1.34 | −2.85 | −2.42 | −0.76 | ||
| MAPRegion | 0.50 | 2.81 | 1.53 | 2.00 | ||||||
| MAP:MATR | 4.49 | 3.40 | 2.63 | |||||||
| Land use (LU) | ForRegion | 2.18 | 2.21 | 1.46 | ||||||
| AgrRegion | −2.72 | −2.16 | ||||||||
| UrbRegion | 0.70 | |||||||||
| Flower β | 4.12 | 2.29 | 2.52 | 4.14 | 2.00 | 3.69 | 3.62 | |||
| Cl:LU | For:MATR | 2.77 | ||||||||
| UrbMATR | −3.39 | |||||||||
| R2/adj. R2 | 0.418/0.364 | 0.297/0.259 | 0.243/0.216 | 0.205/0.178 | 0.376/0.319 | 0.289/0.251 | 0.467/0.417 | 0.299/0.248 | ||
| ΔAICnull | 22.5 | 15.1 | 12.7 | 9.8 | 18.3 | 14.5 | 27.7 | 13.3 | ||
| C | α Diversity | Pollinators | Bees | Hymenoptera | Syrphids | Diptera | Butterflies | Moths | Beetles | |
| Climate (CI) | TLocal | 3.21 | −2.33 | 2.31 | ||||||
| Land use (LU) | HabGraLocal | −6.07 | −3.77 | −6.61 | −3.40 | −4.28 | −2.29 | −4.64 | ||
| HabAgrLocal | −8.93 | −5.57 | −8.05 | −3.87 | −6.15 | −6.21 | −5.86 | |||
| HabUrbLocal | −4.55 | −1.95 | −4.53 | −2.75 | −2.58 | −4.01 | −0.3.76 | |||
| GraLandsc | −2.19 | |||||||||
| AgrLandsc | −2.34 | |||||||||
| UrbLandsc | 2.81 | |||||||||
| EdgeDLandsc | 2.27 | |||||||||
| Flower α | 3.67 | 3.12 | 3.12 | 3.78 | 3.26 | 2.11 | 2.81 | |||
| Marg./cond. R2 | 0.335/0.403 | 0.370/0.487 | 0.301/0.399 | 0.175/0.254 | 0.292/0.329 | 0.073/0.517 | 0.248/0.396 | 0.187/0.327 | ||
| ΔAICnull | 62.1 | 59.8 | 54.8 | 22.8 | 51.2 | 14.5 | 38.8 | 30.2 | ||
