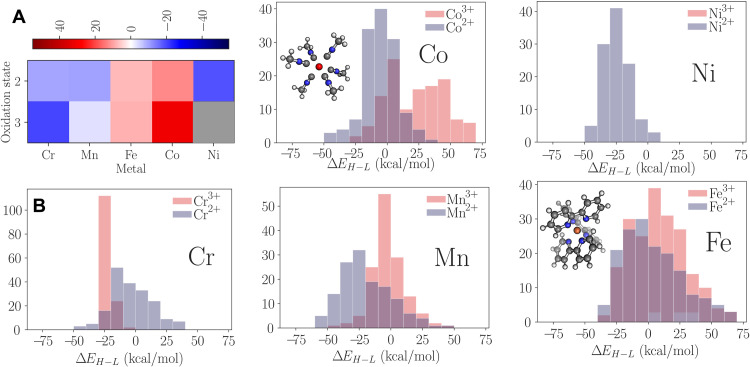
Fig. 6. The model coefficients and dataset distributions for the transition metal complexes.
The (A) contribution from the metal and oxidation state to the predicted spin splitting. The gray indicates that Ni3+ is not present in the dataset. The (B) distribution of ΔEH − L for different metal ions in the dataset. If the difference is positive, then the spin configuration is low, and if the difference is negative, then the spin configuration is high.

