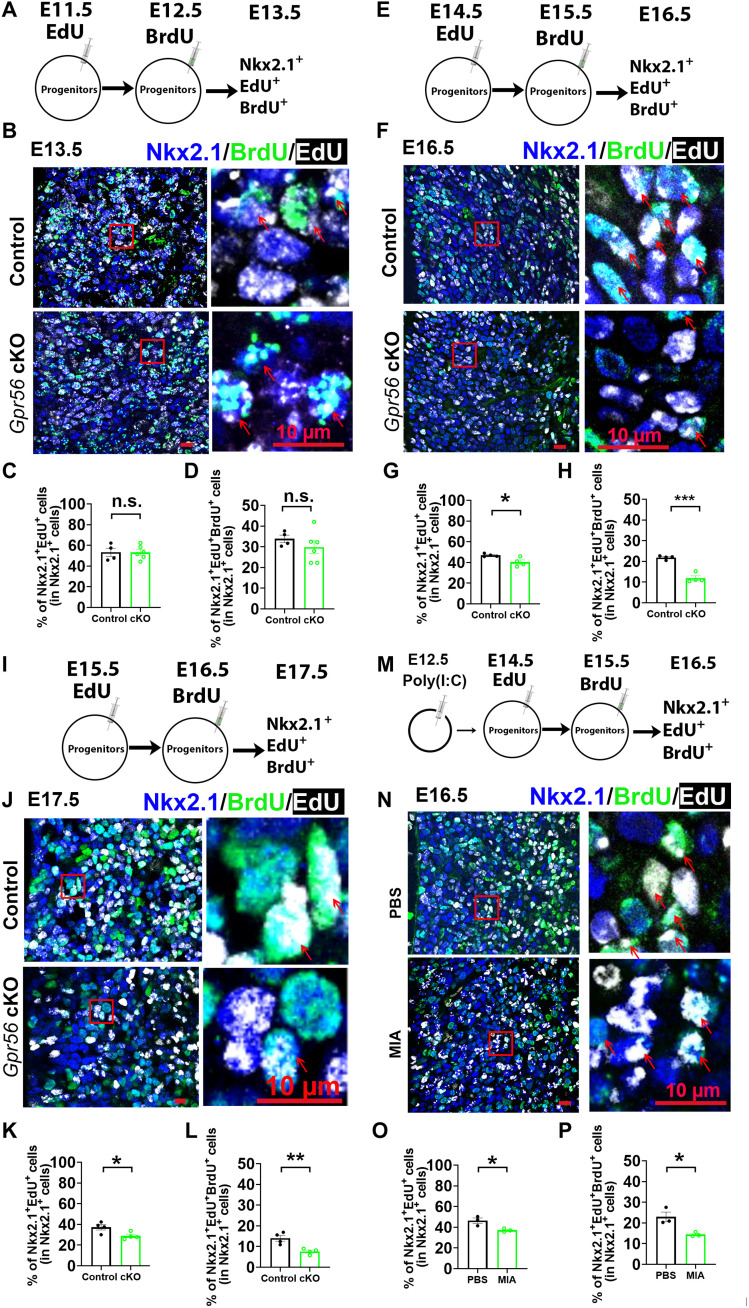
Fig. 4. Both microglial Gpr56 deletion and MIA impairs mid-stage neurogenesis in MGE.
(A) A schematic drawing of early neurogenesis evaluation. (B) Representative images of triple staining of EdU, BrdU, and Nkx2.1 in the E13.5 MGE with EdU injected at E11.5 and BrdU injected at E12.5. (C and D) Bar graphs showing no significant differences between control and Gpr56 cKO mice in the percentages of Nkx2.1+EdU+ cells (C; P = 0.98) and Nkx2.1+EdU+BrdU+ cells (D; P = 0.35). n = 4 in control and n = 6 in cKO. (E to H) Triple staining of EdU, BrdU, and Nkx2.1 to evaluate mid-stage MGE neurogenesis ranging from E14.5 to E16.5. Bar graphs show significantly decreased percentages of Nkx2.1+EdU+ cells (G) and Nkx2.1+EdU+BrdU+ cells (H) in the MGE of Gpr56 cKO mice compared to controls. n = 4. (I to L) Triple staining of EdU, BrdU, and Nkx2.1 to evaluate late-stage MGE neurogenesis ranging from E15.5 to E17.5. Bar graphs showing significantly decreased percentages of Nkx2.1+EdU+ cells (K) and Nkx2.1+EdU+BrdU+ cells (L) in the MGE of Gpr56 cKO mice compared to controls. n = 4. (M to P) Triple staining of EdU, BrdU, and Nkx2.1 to evaluate mid-stage MGE neurogenesis ranging from E14.5 to E16.5 in MIA fetal brains. Bar graphs show a significantly decreased percentage of Nkx2.1+EdU+ cells (O) and Nkx2.1+EdU+BrdU+ cells (P) in the MGE of MIA offspring. n = 3. Red arrows show examples of Nkx2.1+EdU+BrdU+ cells. Unpaired t test. *P < 0.05, **P < 0.01, and ***P < 0.001. Data are presented as means ± SEM.

