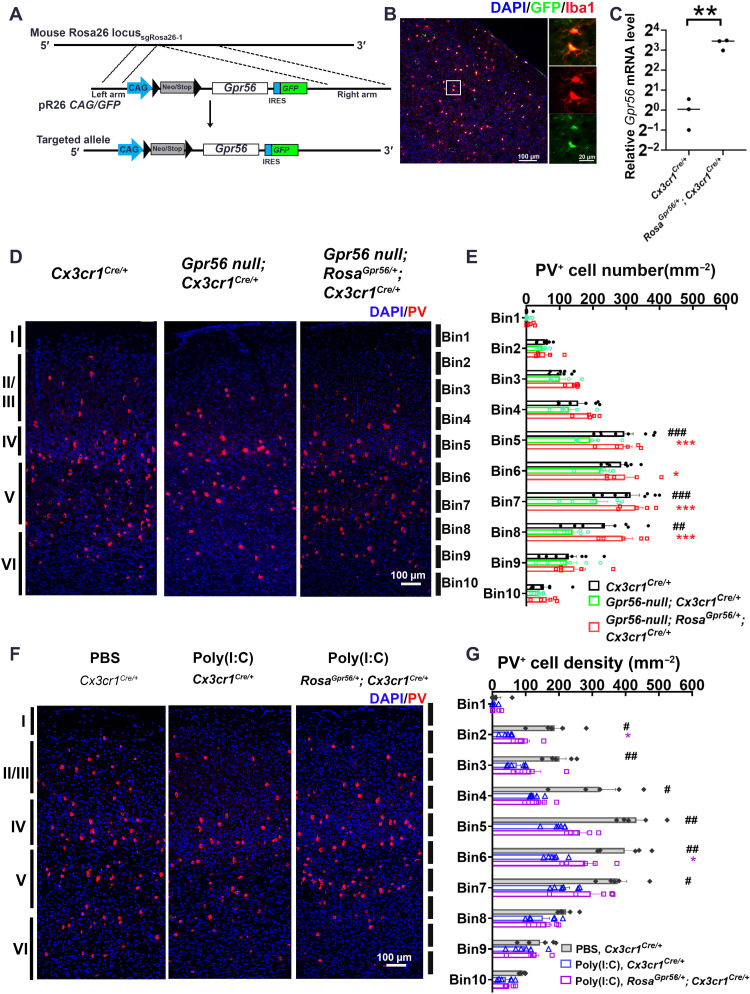
Fig. 7. Restoring microglial Gpr56 expression corrects PV+ interneuron deficits in both global Gpr56 KO mice and MIA offspring.
(A) Strategy for the generation of the RosaGpr56 mouse line. IRES, internal ribosomal entry site. (B) IHC staining showing reporter green fluorescent protein (GFP) is colocalized with Iba1 in the RosaGpr56/+; Cx3cr1Cre/+ mouse brain. (C) Reverse transcription qPCR (RT-qPCR) showing Gpr56 mRNA expression is largely increased in FACS-isolated microglia from RosaGpr56/+; Cx3cr1Cre/+ mice (n = 3). (D) Representative images of PV+ interneurons in the posterior SSC. (E) A bar graph showing PV+ interneuron density in the posterior SSC is decreased in global Gpr56 KO mice compared to control mice, and restoring microglial Gpr56 expression corrects the PV+ interneuron deficits. n = 8 (Cx3cr1Cre/+), n = 6 (Gpr56 null; Cx3cr1Cre/+), and n = 5 (Gpr56 null; RosaGpr56/+; Cx3cr1Cre/+). (F) Representative images of PV+ interneurons in the SSC of control mice (PBS, Cx3cr1Cre/+), MIA offspring [poly(I:C), Cx3cr1Cre/+], and MIA offspring with restored expression of microglial Gpr56 [poly(I:C), RosaGpr56/+; Cx3cr1Cre/+]. (G) A bar graph showing PV+ interneuron density is decreased in MIA offspring compared to controls. The density of PV+ interneurons is increased in MIA offspring with restored expression of microglial Gpr56 compared to control MIA offspring. n = 5 (PBS, Cx3cr1Cre/+), n = 6 [poly(I:C), Cx3cr1Cre/+], and n = 6 [poly(I:C), RosaGpr56/+; Cx3cr1Cre/+]. Unpaired t test for (C): **P < 0.01; two-way ANOVA and post hoc Bonferroni’s test for (E): ##P < 0.01 and ###P < 0.001 between Cx3cr1Cre/+ and Gpr56 null; Cx3cr1Cre/+; *P < 0.05, **P < 0.01, and ***P < 0.001 between Gpr56 null; Cx3cr1Cre/+ and Gpr56 null; RosaGpr56/+; Cx3cr1Cre/+. Two-way ANOVA and post hoc Bonferroni’s test for (G): #P < 0.05 and ##P < 0.01 between PBS, Cx3cr1Cre/+ and poly(I:C), and Cx3cr1Cre/+; *P < 0.05 between poly(I:C), Cx3cr1Cre/+ and poly(I:C), and RosaGpr56/+; Cx3cr1Cre/+. Data are presented as means ± SEM.

