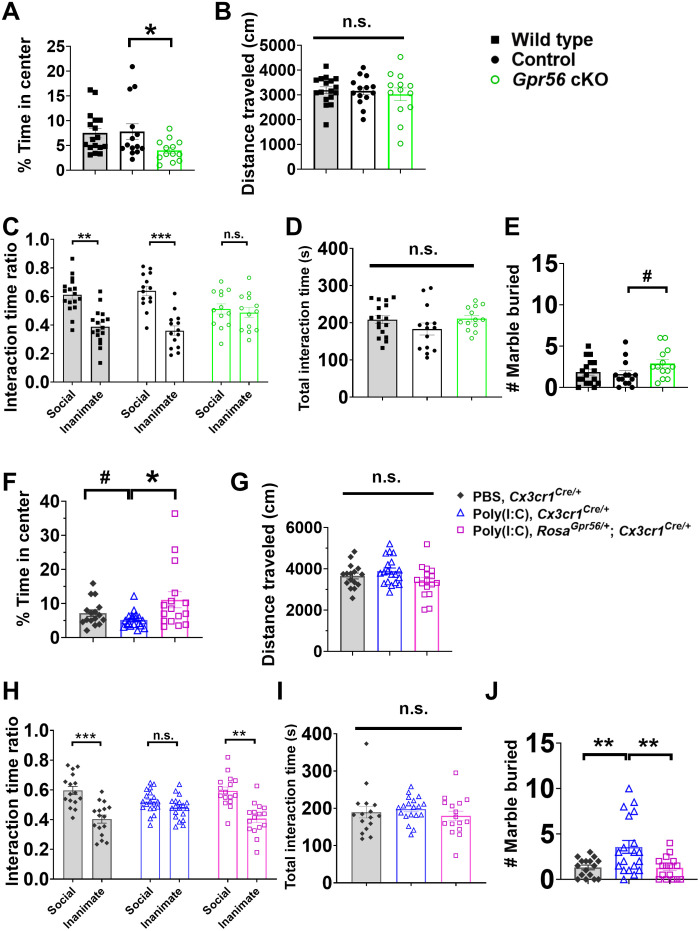
Fig. 8. GPR56 expression status in microglia affects mouse behaviors.
(A) The percentage of time spent in the center of an open field, (B) total distance traveled in an open field (P = 0.80), (C) interaction time ratio in the three-chamber test, (D) total interaction time in the three-chamber test (P = 0.23), and (E) number of marbles buried in marble-burying test in wild-type (n = 17), control (Cx3cr1Cre/+; n = 14), and Gpr56 cKO mice (Gpr56f/f; Cx3cr1Cre/+; n = 13). (F) The percentage of time spent in the center of an open field, (G) total distance traveled in an open field (P = 0.09), (H) interaction time ratio in the three-chamber test, (I) total interaction time in the three-chamber test (P = 0.55), and (J) number of marbles buried in marble-burying test in control mice (PBS, Cx3cr1Cre/+; n = 16), MIA offspring [poly(I:C), Cx3cr1Cre/+; n = 19], and MIA offspring with restored expression of Gpr56 in microglia [poly(I:C), RosaGpr56/+; Cx3cr1Cre/+; n = 16). Two independent experiments. Unpaired t test for (A), (E), (F), and (J); one-way ANOVA test for (B), (D), (G), and (I); and two-way ANOVA and post hoc Bonferroni’s test for (C) and (H). #P < 0.1, *P < 0.05, **P < 0.01, and ***P < 0.001. Data are presented as means ± SEM.

