Abstract
The physicochemical and microbial changes, volatile profile, texture and appearance were investigated in three groups of Sichuan pickles differing in oxygen exposure during a 64 day fermentation process. At the beginning, all the Sichuan pickles displayed similar sensory and fermentation characteristics regarding lactic acid bacteria domination, sugar utilization, and lactate accumulation. Soon afterwards, continued exposure allowed premature pellicle formation and typical aerobic deterioration of Sichuan pickle, accompanied by texture destruction and an odorous stench characterized by arenes and aldehydes on the 32nd day. Meanwhile, the facultative anaerobes including Lactobacillus (90 ± 2%), Pediococcus (4.7 ± 0.3%) and Lactococcus (1.2 ± 0.8%) were the dominant genera and probably associated with acetic acid production and arene enrichment under oxygen exposure conditions on the 32nd day. Until the 48th day, intermittent oxygen exposure resulted in pellicle formation and an unpleasant flavor characterized by ketones, esters and S-methyl thioacetate. In comparison, Sichuan pickle without oxygen exposure always maintained a relatively favorable fragrant scent and texture. Besides Lactobacillus, anaerobic genera were the main bacteria in Sichuan pickle under closed conditions and accounted for 50 ± 9% of the total bacteria on the 32nd day. The study indicated the microbial and chemical characteristics of Sichuan pickles during practical production and provided a theoretical guidance for the industrial production of Sichuan pickle.
The physicochemical and microbial changes, volatile profile, texture and appearance were investigated in three groups of Sichuan pickles differing in oxygen exposure during a 64 day fermentation process.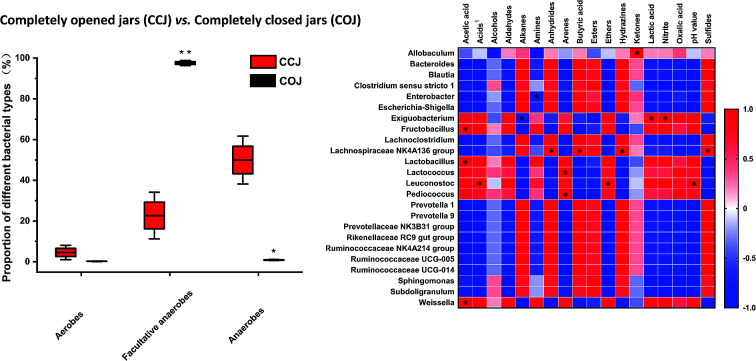
1. Introduction
Sichuan pickle (paocai) is a representative fermented vegetable product of China, which is typically immersed in 6–8% salt brine and allowed to undergo anaerobic lactic acid fermentation in the container.1 Chinese pickle production can be traced back to the Zhou Dynasty 3000 years ago, from which it has spread all over Asia and even Europe.2,3 Today, the production and consumption of Sichuan pickles occur on a significant scale throughout China, as well as the rest of the world. The substantial demand for Sichuan pickle necessitates the industrial production of this product. The annual output of commercial Sichuan pickle has maintained a 30% increase per year over the past five years and exceeded five million tons in 2018. Furthermore, extensive studies have been conducted to provide theoretical guidance and technological support to the industrial production process of Sichuan pickle, regarding the screening of starter cultures,1 the control of pathogens and spoilage agents,4 as well as the impact of chemical factors such as salt concentrations and acidity on the fermentation of Sichuan pickle.3,5
Oxygen exposure is an inevitable environmental factor during vegetable fermentation.6,7 During industrial production, the fermentation of Sichuan pickle may be exposed to different oxygen conditions. In most cases, the Sichuan pickle fermentation containers are sealed with water or plastic film.8 The pickle fermentation process starts aerobically in the containers and gradually becomes anaerobic as the oxygen is consumed. The pickle containers are opened intermittently to remove some of the pickles for post-processing, which inevitably allows the atmospheric oxygen to enter the containers. In certain Sichuan pickle enterprises, the pickle is even fermented without sealing it, and is similar to the American commercial fermentation process of cucumbers, which is conducted within open-top tanks.9
The sensory quality of Sichuan pickle relies on a delicate microbial balance, as well as the anaerobic fermentation process.10,11 Oxygen exposure can impact the growth and metabolism of lactic acid bacteria and fungi on food matrixes, as well as the microbial composition, therefore, leading to inconsistent quality in the Sichuan pickle.12–14 In a previous study, oxygen was demonstrated to be a critical factor in the aerobic deterioration of Sichuan pickle, and was responsible for activating lactic acid degradation, pellicle formation, and the growth of undesirable organisms.15,16 However, sufficient research involving the impact of various existing oxygen conditions during the industrial fermentation process, as well as the sensory quality of Sichuan pickle, remain minimal.
In this study, three groups of Sichuan pickles were fermented using three distinct methods to examine the specific role of oxygen exposure during the fermentation process. These techniques included subjecting the fermentation process to oxygen exposure, intermittent oxygen exposure and closed conditions, respectively, for 64 days. The physicochemical indexes, microbial variation, and sensory features of the Sichuan pickle such as the volatile features, appearance, and texture were carefully analyzed during the 64 day fermentation period. Through high-throughput sequencing and Spearman's correlation analysis, the microbial communities under the exposure and closed condition in certain fermented stage were examined, as well as their correlations with chemical characteristics in Sichuan pickles. The results provided a valuable insight into the actual quality characteristics of Sichuan pickle under different oxygen exposure conditions and supplied a scientific guideline for the industrial fermentation of Sichuan pickle.
2. Materials and methods
2.1. Preparation of Sichuan pickle
Fresh radishes (Raphanus sativus L.) were washed, dried, and placed into 5 L glass jars. The brine was prepared with cool boiled water containing 6% salt (w/v) and inoculated with 106 colony forming units (CFU mL−1) of Lactobacillus plantarum E11, which was an eligible starter developed in previous study for Sichuan pickle fermentation.4 Nine separate jars of Sichuan pickle were prepared and fermented at room temperature for 64 days. Meanwhile, the pickle jars were subjected to different oxygen exposure conditions. The exposure fermentation was achieved in three completely opened jars (COJ). The COJ were covered with the sterilized gauze and stayed in the clean bench. The intermittent exposure fermentation was achieved in three intermittently opened jars (IOJ). The IOJ were carried to the clean bench and their lids were taken off for 1 h per day. The closed fermentation was achieved in three completely closed jars (CCJ). The brine and radishes in pickle jars were sampled at day 0, 8, 16, 32, 48, and 64 respectively.
2.2. Detection of physicochemical indexes and microbial counts of Sichuan pickle
A pH meter (PHS–3C, Fangzhou Technology, China) was used to monitor the pH values of brine samples. The total sugar was measured using the anthrone–sulfuric acid method, while the reducing sugar was determined with the 3,5-dinitrosalicylic acid method.17 The hydrochloride naphthodiamide photometric method was used to determine the concentration of nitrite.18 The concentrations of organic acids in the brine samples were determined using high performance liquid chromatography (HPLC, Agilent, USA). Organic acids in the brine samples were separated by an Aminex HPX-87H column (300 × 7.8 mm, Bio-Rad) with 0.005 mol L−1 H2SO4 as a mobile phase.
The growth of total microbes, lactic acid bacteria (LAB) and fungi in the different jars was monitored by enumeration on tryptose soya agar (TSA), de Man-Rogosa-Sharpe (MRS) agar, and Rose Bengal (RB) agar, respectively. The MRS and RB plates were incubated at 30 °C for 48 h, while the TSA and CC plates were incubated at 37 °C for 36 h.
2.3. Bacterial 16S rRNA gene amplification and Illumina sequencing
Total genomic DNA from the brine samples was extracted using a PowerSoil DNA extraction kit (Mobio, US) and checked by means of a NanoDrop spectrophotometer (Thermo Scientific, US). The V4 hypervariable region of the 16S rRNA gene was targeted for PCR amplification with the primers 515F and 806R.19 Sequencing libraries were generated using a TruSeq DNA PCR-Free Sample Prep Kit (Illumina, US) and index codes were added. The library quality was assessed on the Qubit® 2.0 Fluorometer (ThermoFisher Scientific, US) and Agilent Bioanalyzer 2100 system. Finally, the library was applied to paired-end sequencing (2 × 250 bp) with the Illumina HiSeq apparatus.
The sequencing results were analyzed according to Usearch (http://drive5.com/uparse/) and QIIME.20 Paired-end reads from the original DNA fragments were merged using FLASH.21 Then, sequences were assigned to each sample according to the unique barcode. Relatively stringent quality controls were applied throughout. The low quality reads (with length <200 bp, more than two ambiguous base ‘N’s, or an average base quality score <30) and truncated sequences in which quality scores decayed (score < 11) were filtered out. After the discovery of duplicated sequences, all singletons were discarded as a potential bad amplicon (http://www.drive5.com/usearch/manual/singletons.html), thus resulting in an overestimation of diversity. Sequences were clustered into operational taxonomic units (OTUs) at a 97% identity threshold using UPARSE algorithms.22 Representative sequences were picked and potential chimeras removed using the UCHIME algorithm.23 Taxonomies were assigned using the SILVA database24 and Uclust classifier in QIIME.
2.4. Analysis of the volatile organic compounds (VOCs) in Sichuan pickle
The VOCs of the brine samples at various fermentation stages were determined with a gas chromatograph mass spectrometer (GCMS-QP2010 Plus, Shimadzu, Japan). A RET-5 elastic quartz capillary column (30.0 m × 0.32 mm × 0.25 μm) was used. The samples were extracted using a 50/30 μm DVB/CAR/PDMS SPME head. n-Alkanes were run under the same conditions as the brine samples. Identification of the VOCs was based on the mass spectral database, while the Kovats Index was used to compare their properties to those from existing literature. 2-Methyl-3-heptanone was used as the internal standard. The relative peak area abundance of each VOC was calculated against the internal standard peak area.
2.5. Texture, sensory analysis and observation of pellicle formation
The texture of Sichuan pickle was analyzed with a texture analyzer TA-XT Plus (Stable Micro System, Surrey, UK), equipped with a P/5 probe. A panel of housewives from Sichuan province and trained college students evaluated the pickle products from different jars. Panelists scored for overall acceptability, using a hedonic scale (−3 to 3). The score of 0 was considered as the borderline of acceptability. The score of −3 was considered as extremely dislike and terrible stench. The score of 3 was considered as extremely like and fragrant scent. The pellicles, which formed at the air–brine interface of the pickle brine were visually identified and recorded.
2.6. Statistical analysis
The results presented in the following tables and figures are expressed as the average determined from three batches for each sample category. Significant differences were ascertained by performing an analysis of variance (ANOVA) using GraphPad Prism 7.0. Heat maps showing the flavor properties of different pickle jars were constructed using GraphPad Prism 7.0. Principal component analysis (PCA) was used to investigate the flavor data in different pickle jars by IBM SPSS statistics 20 and Origin 2018. The correlation index was calculated using Spearman's correlation analysis. Spearman's correlation analysis was performed using the OmicShare tools, a free online platform for data analysis (http://www.omicshare.com/tools). PRISM 7 (Graphpad Software) was applied to visualize the interaction hot map between bacteria communities and chemical characteristics.
3. Results
3.1. Changes in pH value, nitrite concentrations, total sugar, and reducing sugar
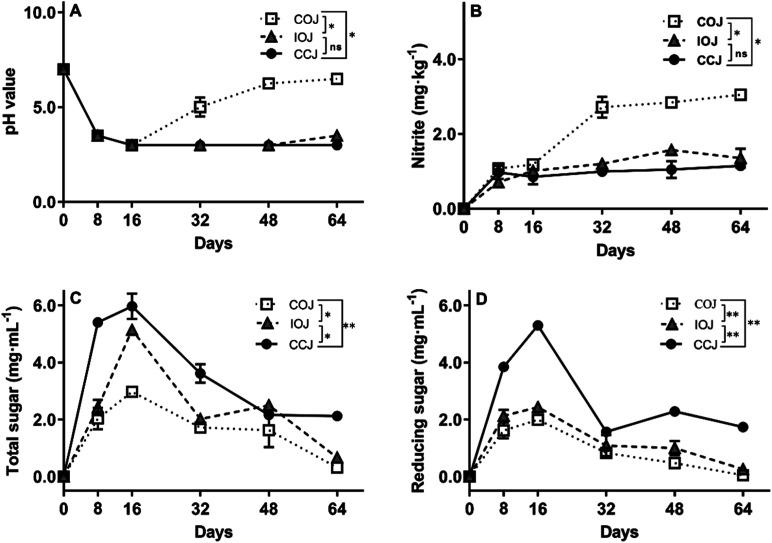
The pH value changes in the different jars during the fermentation process are shown in Fig. 1A. The brine samples in all jars displayed a continual decline in pH value from 7.0 to 3.0 within the first 16 days. In CCJ and IOJ, the pH value tended to be stable at 3.0 after the 16th day, exhibiting a slight pH increase to 3.5 ± 0.0 in IOJ on the 64th day. However, the pH value in COJ tended to increase gradually from the 32nd day and reached 6.5 ± 0.0 on the 64th day. The nitrite concentrations in CCJ and IOJ seemed relatively stable for the duration of the fermentation process (Fig. 2B). The nitrite content of COJ increased considerably from the 32nd day and exceeded 3.0 mg kg−1 in Sichuan pickle on the 64th day, which was still lower than the warning level of 20.0 mg kg−1 established by the Chinese National Food Safety Standard25 and the acceptable daily intake of 0.07 mg per kg body weight (4.2 mg nitrite for an adult of 60 kg) recommended by the World Health Organization.26
Fig. 1. Changes in pH value (A), nitrate (B), total sugar (C), and reducing sugar (D) content during the fermentation process of Sichuan pickle in COJ (white square with dotted line), IOJ (grey triangle with dashed line), and CCJ (black round with solid line). Values are the mean ± standard deviation (SD) from the experiments performed in triplicate, and significant difference is analyzed by t-test: (ns) p > 0.05, (*) p ≤ 0.05 and (**) p ≤ 0.01.
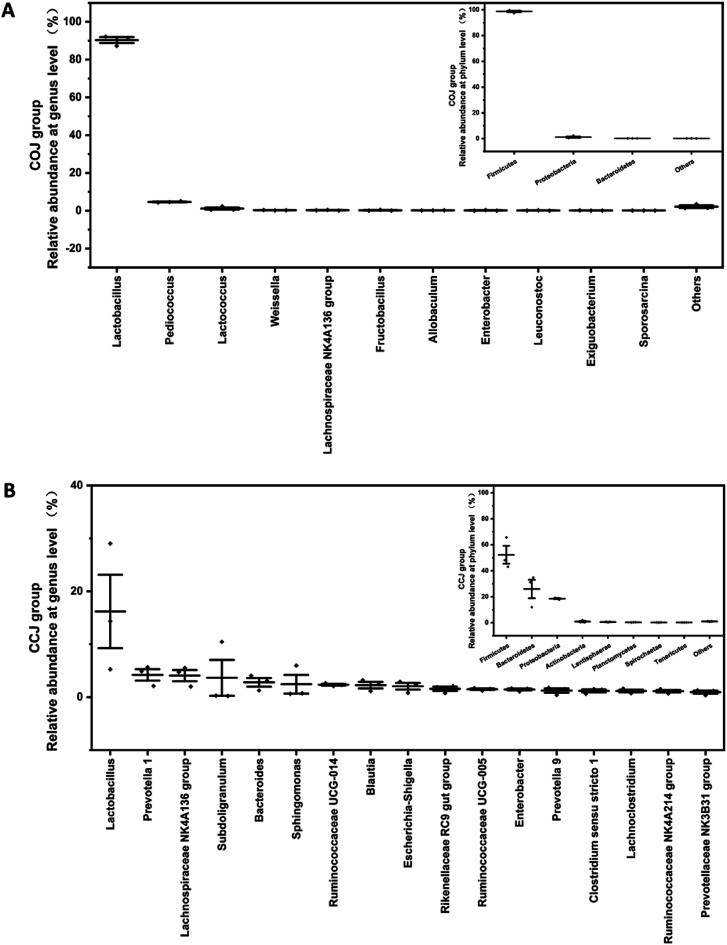
Fig. 2. Comparison of bacterial compositions on the 32nd day's (A) CCJ and (B) COJ at phylum and genus levels. The relative abundances of phylum shown in CCJ and COJ are more than 0.1%. The relative abundances of genera shown in CCJ and COJ are more than 1.0% and 0.1%, respectively. The genera with relative abundances between 0.1% to 1.0% in CCJ were shown in Fig. S3.†.
All brine samples from various pickle jars presented an increase in both total sugar and reducing sugar within the first 16 days while exhibited a gradual decline over the subsequent fermentation stages (Fig. 1C and D). The levels of total sugar and reducing sugar in the brine of COJ were consistently lower than those of IOJ and CCJ during the 64 day fermentation.
3.2. Microbial variations during the fermentation process
The LAB dominated the microbial communities at the beginning and maintained their quantitative superiority in all jars until the 16th day (Fig. S1A and B†). The total microbial counts and LAB in all jars emerged as a peak number (nearly 8.0 log CFU mL−1) on the 8th day and declined to about 6.0 log CFU mL−1 on the 16th day. From the 32nd day, the total microbial counts in the brine of IOJ and COJ increased again, while the numbers of LAB continued to decline. The COJ group, in particular, displayed a climb in the total microbial counts to 8.73 ± 0.06 log CFU mL−1, while the number of LAB reduced to about 3.0 ± 0.2 log CFU mL−1 on the 64th day. The level of total microbes in CCJ remained consistently lower than other groups, while the total microbial and LAB counts were relatively stable after the 16th day. The number of fungi in both COJ and IOJ increased during the 64 day fermentation period (Fig. S1C†). The fungal levels in COJ were always higher than they were in IOJ and CCJ. The fungal counts increased slowly in CCJ during the first 16 days and presented no apparent subsequent fluctuation.
3.3. Comparison of bacterial communities between COJ and CCJ
The bacterial communities of CCJ and COJ on the 32nd day, which was the turning point of microbial and physicochemical changes, were further investigated. A total of 236 879 resampled sequencing reads were generated from 6 Sichuan pickle samples in CCJ and COJ of day 32. Among these reads, 4251 unique and classifiable representatives were identified at a high sequence similarity level of 97%. The saturation phase of Shannon curves (Fig. S2†) suggested that most bacterial phylotypes present in the pickle samples had already been captured.
The bacterial α-diversity indices, richness indices (Chao 1) and diversity indices (Shannon) were evaluated (Table 1). The results indicated that the bacterial diversity of CCJ on day 32 was significantly higher than that of COJ. The relative abundance at the phyla and genera levels in COJ and CCJ were analyzed (Fig. 2). At the phyla level, Firmicutes held a high proportion (98.4 ± 0.9%) in COJ, followed by Proteobacteria (1.0 ± 0.9%) and Bacteroidetes (0.10 ± 0.00%). At the genera level, only 3 genera, namely Lactobacillus (90 ± 2%), Pediococcus (4.7 ± 0.3%) and Lactococcus (1.2 ± 0.8%), presented the relative abundance of more than 1%. The relative abundances of 8 genera, such as Weissella, Lachnospiraceae NK4A136 group, and Fructobacillus, were more than 0.1%. In CCJ, Firmicutes occupied the relative abundance of 52 ± 9%, followed by Bacteroidetes (26 ± 9%), Proteobacteria (17.6 ± 0.6%), Actinobacteria (1.0 ± 0.7%), Lentisphaerae (0.6 ± 0.2%), Planctomycetes (0.29 ± 0.06%), Spirochaetae (0.20 ± 0.03%) and Tenericutes (0.16 ± 0.02%). At the genera level, Lactobacillus (16 ± 9%) were also the dominant genera in CCJ and the relative abundances of the other 16 genera were more than 1%, (Fig. 2A). Furthermore, the relative abundances of 58 genera were more than 0.1% in CCJ (Fig. S3†).
Comparison of α diversity indices of bacterial communities across Sichuan pickles in COJ and CCJa.
| COJ | CCJ | |
|---|---|---|
| Observed | 143 ± 3 | 2127 ± 326* |
| Chao1 | 191 ± 6 | 2587 ± 385* |
| Shannon | 1.5 ± 0.1 | 6.2 ± 0.6* |
| PD | 9.8 ± 0.6 | 143 ± 16** |
Significant difference is analyzed by t-test: (*) p ≤ 0.05 and (**) p ≤ 0.01.
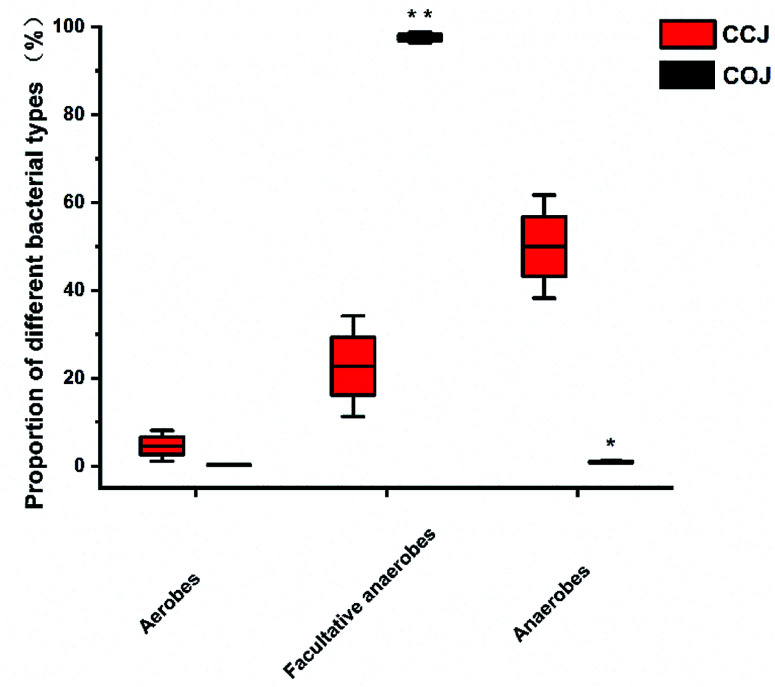
The proportions of aerobes, facultative anaerobes and anaerobes in COJ and CCJ on the 32nd day were also analyzed (Fig. 3). Significantly, more anaerobic bacteria existed in CCJ condition, while facultative anaerobes were the main bacteria in COJ.
Fig. 3. The proportion of aerobes, facultative anaerobes and anaerobes in the Sichuan pickles of COJ and CCJ on the 32nd day. Significant difference is analyzed by t-test: (*) p ≤ 0.05 and (**) p ≤ 0.01.
3.4. Comparison of organic acid levels between different exposure conditions
During the fermentation period, an accumulation of lactic acid was evident in CCJ and reached a maximum of 87 ± 9 mM by the 48th day (Table 2). While acetic acid was present in the brine of CCJ, it was in significantly low concentrations that were consistently less than 1.8 mM. Butyric acid was detected in CCJ from the 32nd day and reached a peak of 25 ± 2 mM by the 48th day. The concentration of oxalic acid in CCJ ranged from 69 ± 3 mM to 76 ± 4 mM. The dynamic changes of the different organic acids in IOJ were similar to that in CCJ but stood in complete contrast with the organic acid modifications in the COJ group. In particular, from the 32nd day, substantial consumption of both the lactic acid and oxalic acid in the COJ were evident. The unmistakable accumulation of acetic acid occurred in COJ during the latter stage of the fermentation process and reached a peak of 17.3 ± 0.3 mM by the 64th day. Additionally, day 64 marked the disappearance of oxalic acid that was previously detected in COJ.
Organic acid changes during the fermentation process of Sichuan pickle in COJ, IOJ and CCJ.
| Days | Lactic acida,b,c | Acetic acid | Butyric acid | Oxalic acid | ||||||||
|---|---|---|---|---|---|---|---|---|---|---|---|---|
| COJ | IOJ | CCJ | COJ | IOJ | CCJ | COJ | IOJ | CCJ | COJ | IOJ | CCJ | |
| 8 | 42 ± 5 cd | 36 ± 5 d | 51 ± 6 cd | 0.5 ± 0.3 cd | 0.5 ± 0.0 cd | 0.7 ± 0.1 cd | nd | nd | nd | 76 ± 8 ab | 67 ± 7 b | 74 ± 1 ab |
| 16 | 45 ± 9 cd | 54 ± 5 c | 62.2 ± 0.1 bc | 0.4 ± 0.4 d | 0.8 ± 0.1 cd | 0.8 ± 0.1 cd | nd | nd | nd | 72 ± 4 b | 72 ± 4 b | 70 ± 4b |
| 32 | 88.0 ± 0.8 ab | 94 ± 3 a | 75 ± 6 b | 5.2 ± 0.8 b | 3 ± 1 c | 1.6 ± 0.1 cd | 10.7 ± 0.3 d | 20 ± 2 b | 16 ± 2 c | 81 ± 4 ab | 80 ± 8 ab | 69 ± 3 b |
| 48 | 80 ± 8 ab | 95 ± 7 a | 87 ± 9 ab | 6 ± 2 b | 2 ± 1 cd | 1.8 ± 0.5 cd | 11.0 ± 0.2 d | 25.6 ± 0.5 a | 25 ± 2 a | 62 ± 3 b | 85 ± 1 a | 76 ± 4 ab |
| 64 | 3 ± 2 e | 66 ± 2 bc | 84 ± 5 ab | 17.3 ± 0.3 a | 2.1 ± 0.3 cd | 1.8 ± 0.0 cd | 17 ± 1 bc | 18.6 ± 0.7 bc | 24 ± 2 a | nd | 71 ± 2 b | 71.7 ± 0.0b |
Data was expressed as mean ± SD. All three samples displayed significant differences in the presence of organic acids.
The significance difference was analyzed by the method of least significant difference, and values in the same row followed by different letters are significant (p < 0.05).
nd: Not detected.
3.5. Comparative analysis of the VOCs in Sichuan pickle under different conditions
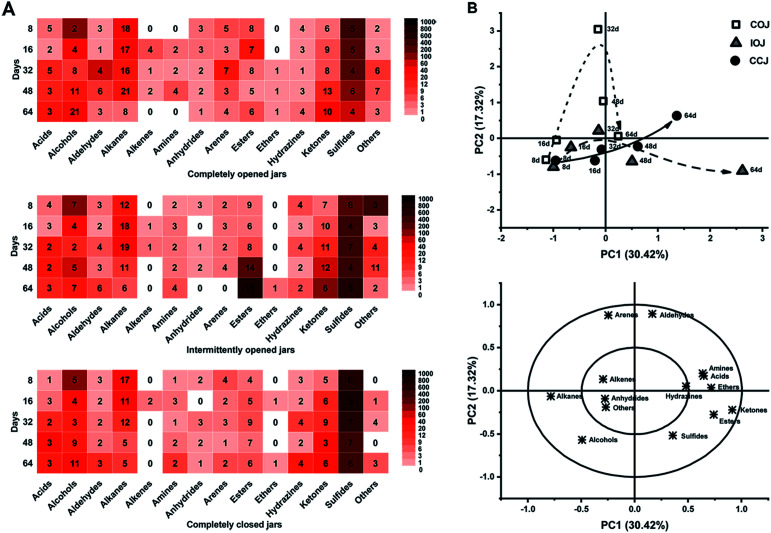
A total of 372 kinds of VOCs were detected, and were attributed to 13 classes including acids, alcohols, aldehydes, alkanes, alkenes, amines, anhydrides, arenes, esters, ethers, hydrazines, ketones, sulfides, and several others (Fig. 4A). Sulfide compounds, which exhibited high abundance in the fresh radish juice (Table S1†), were also present in all pickle brine samples from the different jars (COJ, IOJ and CCJ). PCA was conducted based on the abundance of different VOC classes, and both the score and loading plots are shown in Fig. 4B. The heat maps (Fig. 4A) and PCA analysis (Fig. 4B) indicated that the VOC levels of different classes in COJ, IOJ, and CCJ were similar during the first 16 days. From the 32nd day, considerable diversity became apparent in the VOC variation of different jars. As illustrated by Fig. 4B, the variation trend of IOJ during the fermentation process moved along the PC1 axis (30.42% of the total variance), and was primarily represented by ketones and esters. Esters, especially ethyl esters, displayed significant accumulation in the 48th day and 64th day samples of IOJ (Table S1†). Ketones were found in all jars during the last fermentation stage and presented higher levels in IOJ samples. For the PC2 axis (17.32%), significant levels of aldehydes and arenes were evident in COJ samples (Fig. 4B). Dimethyl acetaldehydes were representative of typical aldehydes, while xylenes and di-tert-butylphenols were the dominant aromatic compounds in the COJ samples particularly by the 32nd day (Table S1†). Compared those of IOJ and COJ, the samples from CCJ presented a slower and steadier change during the fermentation process (Fig. 4B). The level of VOCs was consistently lower in CCJ than in COJ and IOJ, and the density of each class of VOCs in CCJ was uniform (Fig. 4A).
Fig. 4. (A) Heatmap of different classes of volatile flavor compounds (VOCs) during the fermentation process of Sichuan pickle. Different color bars indicate the relative abundance of each VOC class; (B) PCA score and loading scatter plots performed on different classes of VOCs in COJ (white square), IOJ (grey triangle), and CCJ (black round). The directions of the curved arrows indicate the routes of the fermentation time of Sichuan pickle.
3.6. Correlation between bacterial genera and chemical characteristics
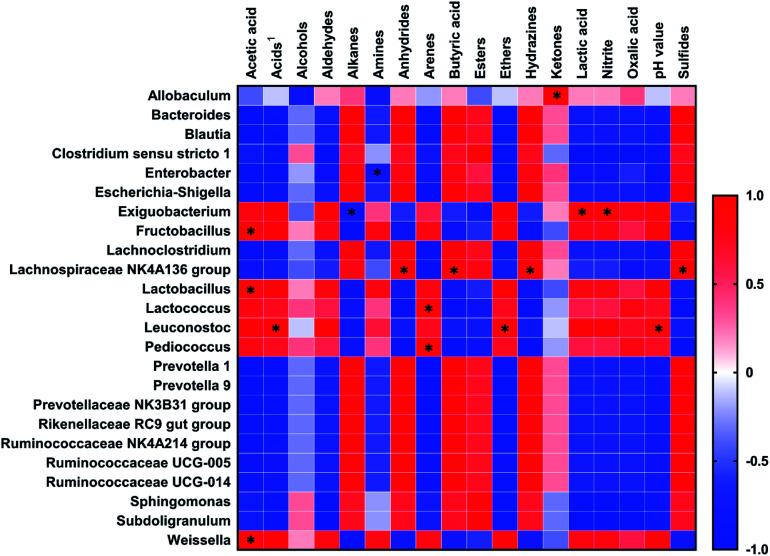
The Spearman's correlations between dominant genera (relative abundance >0.1% in COJ and >1% in CCJ) and the chemical characteristics (pH, nitrite, VOCs and organic acids) on the 32nd day are shown in Fig. 5. pH was positively related to Leuconostoc (p < 0.05). Nitrite was positively correlated to Exiguobacterium (p < 0.05). Lactic acid and butyric acid were positively linked to Exiguobacterium (p < 0.05) and Lachnospiraceae NK4A136 group (p < 0.05), respectively. Acetic acid was positive affected by Fructobacillus (p < 0.05), Lactobacillus (p < 0.05) and Weissella (p < 0.05). VOCs were significantly influenced by 7 genera. Arenes were positively related to Lactococcus (p < 0.05) and Pediococcus (p < 0.05). Ketones were positively correlated to Allobaculum (p < 0.05), while sulfides were positively correlated to Lachnospiraceae NK4A136 group (p < 0.05).
Fig. 5. Correlation matrix of the Spearman rank correlation between dominant species and chemical characteristics in Sichuan pickles. The Spearman coefficient +1.0 was considered as a strongly positive correlation, while −1.0 was considered as a strong negative correlation. *, p ≤ 0.05.
3.7. Texture, appearance, and sensory characteristics of Sichuan pickle in different conditions
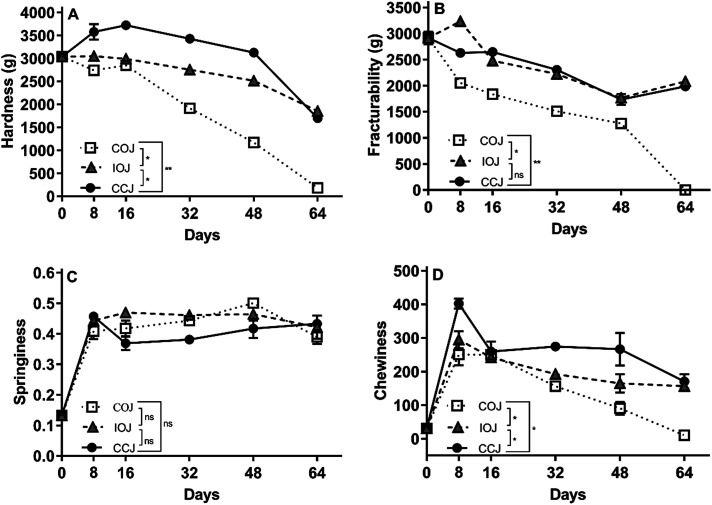
The texture changes during the fermentation process including hardness, fracturability, springiness, and chewiness are shown in Fig. 6. The COJ pickle exhibited the most significant changes in these characteristics since they were reduced to an extremely low level by the 64th day. During the entire fermentation process, the CCJ pickle samples maintained a higher level of firmness and chewiness than the other specimens did. The level of fracturability in the IOJ and CCJ pickle samples were higher than COJ. No significant difference was observed in the springiness of the pickle samples from different jars.
Fig. 6. Texture changes during the fermentation process of Sichuan pickle in COJ (white square with dotted line), IOJ (grey triangle with dashed line), and CCJ (black round with solid line). Values are the mean ± SD from the experiments performed in triplicate, and significant difference is analyzed by t-test: (ns) p > 0.05, (*) p ≤ 0.05 and (**) p ≤ 0.01.
A sporadic and fragile pellicle was formed in the air–brine interface of COJ from the 8th day, and an unpleasant odor emerged from the 16th day (Table 3). A strong stench emanated from the COJ by the 32nd day and the pellicle became thicker as the fermentation process progressed. Smooth pellicle formed on the brine surface of IOJ by the 48th day, and an undesirable flavor appeared on the 64th day (Table 3). No pellicle was observed in the CCJ samples for the duration of the fermentation period, and the odor consistently remained pleasant.
Pellicle formation and sensory analysis during the fermentation process of Sichuan pickle in COJ, IOJ and CCJ.
| Days | Pellicle formationa | Sensory analysisb | ||||
|---|---|---|---|---|---|---|
| COJ | IOJ | CCJ | COJ | IOJ | CCJ | |
| 8 | + | − | − | 0.89 ± 0.03 d | 0.95 ± 0.05 d | 0.97 ± 0.07 d |
| 16 | ++ | − | − | −1.5 ± 0.2 g | 2.6 ± 0.3 b | 2.8 ± 0.2 a |
| 32 | +++ | − | − | −2.6 ± 0.2 h | 2.2 ± 0.2 c | 2.6 ± 0.2 ab |
| 48 | ++++ | ++ | − | −2.8 ± 0.2 h | 0.5 ± 0.2 e | 2.6 ± 0.2 b |
| 64 | ++++ | ++ | − | −2.8 ± 0.2 h | −1.1 ± 0.2 f | 2.3 ± 0.3 bc |
The number of “+” symbols indicate the strength and thickness of the pellicle, and the corresponding images are shown in Fig. S2. − No pellicle formation.
The score of −3 was considered as extremely dislike and terrible stench. The score of 3 was considered as extremely like and fragrant scent. The significance difference was analyzed by the method of least significant difference, and different letters are significant (p < 0.01).
4. Discussion
Deep and elaborative exploration of the correlations among the environmental factors, microbial profile and chemical composition in fermented food is the precondition of the industrialization. Extensive studies have been conducted to provide theoretical guidance and technological support to the industrial production of Sichuan pickle, regarding the influence of salt concentration,3 acidity,5 fermentation container27 and geographical environments28 on the fermentation and product quality. Different oxygen exposure conditions actually exist in the industrial production of Sichuan pickle. Therefore, the impact of the oxygen exposure condition on the microbial and chemical characteristics of Sichuan pickle, was illustrated in the present study.
During the early phase of Sichuan pickle fermentation, no significant difference was evident in microbial changes and organic acid accumulations under different oxygen exposure conditions. The amounts of total microbes, dominated by the LAB, reached a peak by the 8th day, and declined to the original level by the 16th day. Similar result was found in previous studies.4 The carbon source utilized by LAB mainly consisted of free sugars liberated from the vegetables.29 The increase in sugar at the beginning (Fig. 1C and D) was presumably due to the rapid liberation of free sugars from the vegetables rather than the consumption of sugar by LAB.15 The homolactic and hetero-fermentative metabolism of fermented carbohydrates by LAB produced mainly lactic acid, as well as acetic acid and ethanol.14 Therefore, the sharp decline of pH until the 16th day was mainly ascribed to the lactate enrichment (Table 2 and Fig. 1A).
The apparent divergence, regarding the pH, nitrite content, microbial counts, organic acid levels and VOCs properties, emerged on the 32nd day among different oxygen exposure groups. The degradation of lactic acid and the increase of acetic acid in COJ from the 32nd day might be related to the premature pellicle formation in COJ (Table 2), which was considered as an indicator of lactate utilization and aerobic deterioration.7 The resulting pH elevation (Fig. 1A) from the 32nd day provided alleviation in acid stress and initiated the rapid growth of undesirable organisms such as fungi (Fig. S2C†).7,9 The fungi presented in COJ might play a vital role in the production of plant cell-wall degrading enzyme and coincide with significant texture collapse in Sichuan pickle (Fig. 6).30
The bacterial diversity in COJ and CCJ on the 32nd day were further investigated. Six genera, namely Lactobacillus, Pediococcus, Lactococcus, Lachnospiraceae NK4AA136 group, Allobaculum and Enterobacter, which were common LAB in Sichuan pickles,5 were found in both COJ and CCJ groups (Fig. 2). In COJ, the dominant facultative anaerobes (98 ± 1%) were mainly Lactobacillus (90 ± 2%), followed by Pediococcus (4.7 ± 0.3%) and Lactococcus (1.2 ± 0.8%). Amphimicrobian Weissella, Fructobacillus, Enterobacter, Leuconostoc and Exiguobacterium, which presented more than 0.1% but less than 1% relative abundances in COJ, have been reported in industrial produced Sichuan pickles.31,32 Although LAB were still the dominant bacteria in COJ on the 32nd day, the fermentation seemed to convert to spoilage initiation. The Spearman's correlation analysis suggested the content of acetic acid in Sichuan pickles was affected by Lactobacillus and Fructobacillus (Fig. 5). It has been reported that Lactobacillus could participate in the conversion of lactic acid to acetic acid and initiate the aerobic deterioration of fermented vegetables.7
The relative abundance of Lactobacillus (16 ± 9%) in CCJ still ranked no. 1 but was quite lower than that in COJ (Fig. 2). Besides Lactobacillus, Escherichia-Shigella (2.1 ± 0.9%) and Enterobacter (1.5 ± 0.3%), were the main facultative anaerobes in CCJ. Escherichia-Shigella was always recognized as harmful bacteria and also reported to be related to nitrite concentration in paocai.18 However, the elevation of nitrite content existed in COJ seemed to correlate with Exiguobacterium (Fig. 5), which was found to be positive for nitrate reduction.33 Anaerobic genera occupied 50 ± 9% of the total bacteria in CCJ, confirming the anaerobic condition in CCJ (Fig. 3). Most anaerobes found in CCJ were common genera in the digestive tract and tightly associated with the butyrate production and utilization.34 The high level of butyric acid in CCJ might be attributed to these anaerobes, however, the correlation between the anaerobes and butyric acid in CCJ was not significant in the present study (Fig. 5). Subdoligranulum and genera belonging to Ruminococcaceae in CCJ were also found in fermented potherb mustard under carbon dioxide and nitrogen condition.35
The chemical substances produced by biological metabolism during the pickle fermentation are very complex. Using the existing analytical techniques, it is difficult to obtain qualitative and quantitative results of all chemical constituents in pickle products. Combined with the chromatographic analysis and sensory evaluation, 13 classes of VOCs in Sichuan pickles under different oxygen exposure conditions were preliminary tested in the present study (Fig. 4 and Table S1†). Sensory analysis suggested that the unpleasant odors emerged in COJ from the 16th day and became stronger on the 32nd day (Table 3). Analysis of the VOCs showed that arenes and aldehydes dominated COJ samples on day 32 (Fig. 4B). In COJ, the high level of xylenes, existing in fresh radish juice (Table S1†), might be attributed to the extensive texture destruction for the radishes. Similarly, xylenes were also detected in kimchi as reported by Kang and others.36 Di-tert-butylphenols and 2,4-dimethylbenzaldehyde, which was previously detected in fermented vegetable,37 existed with high level in 32nd day pickle of COJ. The Spearman's correlation analysis suggested that the increase of arenes in COJ was linked with Lactococcus and Pediococcus (Fig. 5). Pediococcus has been reported to relate to the deterioration of fermented cucumber.9 Until the 64th day, alcohols and ketones, which displayed a low odor threshold, dominated the VOCs in COJ. 21 kinds of alcohols were found in COJ by the 64th day, of which 13 differed from those found in IOJ and COJ. Heptanone, nonanone, and octanone were the unique and dominant ketones in the COJ samples. These ketones were often found in wine and described to have buttery and fatty odors.38
The intermittent oxygen exposure (the IOJ approach) resulted in pellicle formation until the 48th day. The lactate utilization was evident by the 64th day in IOJ. It seemed that the intermittent exposure conditions of IOJ enriched the ketones and esters in Sichuan pickle during the latter stage of fermentation (Fig. 4B). The highest content of ketones, mainly 1-mercapto-propanone, were found in the IOJ samples during the 48th day and 64th day. Ethyl esters, which was considered a vital olfactory compound in fermented food with fruity odors, were much higher in IOJ by the 64th day than any other jars.39 Additionally, the difference of VOCs between the IOJ and CCJ samples after the 48th day moved in a negative direction of PC2 and was characterized by sulfide compounds (Fig. 4B). Volatile sulfide compounds have highly distinctive olfactory properties due to their extremely low odor thresholds, and their variation can lead to either consumer acceptance or rejection.40,41 Dimethyl disulfide and dimethyl trisulfide were present in all pickle jars. S-methyl thioacetate enriched largely in IOJ during the latter stage of the fermentation period, and that might be partially responsible for the unpleasant odor of the IOJ samples from the 48th day. By contrast, the physicochemical indexes and pickle texture were relatively stable in CCJ with the excessive acid stress and closed condition after the 32nd day. The flavor of Sichuan pickle in CCJ was acceptable and possessed the distinctive fragrant scent. The variation of VOCs during the anaerobic fermentation in CCJ was slow and organized (Fig. 4B).
5. Conclusion
It was found that Sichuan pickle under oxygen exposure condition was prone to rapid deterioration. After 32 day's fermentation, it was the facultative anaerobes including Lactobacillus, Pediococcus and Lactococcus dominating the Sichuan pickle in COJ. These species seemed to be correlated to the spoilage initiation, regarding pH elevation, lactate consumption and stench emergence. The long-term fermentation raised the deterioration risk of Sichuan pickle under the intermittent exposure condition and led to the unpleasant odor characterized by ketones, esters and S-methyl thioacetate. The chemical characteristics could keep relative stable in CCJ for a long time and the anaerobic genera were the dominant bacteria on the 32nd day. It is recommended for Sichuan pickle to reduce the frequency of opening the fermented container and control the fermentation time to maintain the lactic acid fermentation and quality of pickle products.
Conflicts of interest
There are no conflicts to declare.
Supplementary Material
Acknowledgments
This work was financially supported by the National Natural Science Foundation for Young Scientists of China (31701579), the Applied Basic Research Programs of Science and Technology Department of Sichuan Province (2019YJ0388), the Young Scholars Reserve Talents Program of Xihua University (0220170307), and the Open Project Program of Beijing Key Laboratory of Flavor Chemistry, Beijing Technology & Business University (SPFW2019YB02).
Electronic supplementary information (ESI) available. See DOI: 10.1039/c9ra05994f
References
- Liu A. P. Li X. Y. Pu B. Ao X. L. Zhou K. He L. Chen S. J. Liu S. L. J. Agric. Food Chem. 2017;65:2580–2587. doi: 10.1021/acs.jafc.7b00050. [DOI] [PubMed] [Google Scholar]
- Xiong T. Peng F. Liu Y. Deng Y. Wang X. Xie M. LWT–Food Sci. Technol. 2014;59:713–717. doi: 10.1016/j.lwt.2014.05.059. [DOI] [Google Scholar]
- Xiong T. Li J. Liang F. Wang Y. Guan Q. Xie M. LWT–Food Sci. Technol. 2016;69:169–174. doi: 10.1016/j.lwt.2015.12.057. [DOI] [Google Scholar]
- Rao Y. Chang W. Xiang W. Li M. Che Z. Tang J. J. Food Saf. 2013;33:445–452. doi: 10.1111/jfs.12075. [DOI] [Google Scholar]
- Cao J. Yang J. Hou Q. Xu H. Zheng Y. Zhang H. Zhang L. Food Control. 2017;78:14–23. doi: 10.1016/j.foodcont.2017.02.006. [DOI] [Google Scholar]
- Franco W. Pérez-Díaz I. M. Food Microbiol. 2012;32:338–344. doi: 10.1016/j.fm.2012.07.013. [DOI] [PubMed] [Google Scholar]
- Rao Y. Qian Y. She X. Yang J. He P. Jiang Y. Wang M. Xiang W. Int. J. Food Sci. Technol. 2018;53:767–775. doi: 10.1111/ijfs.13652. [DOI] [Google Scholar]
- Li K. Lin K. Li Z. Zhang Q. Song F. Che Z. Chen G. Xiang W. Food Sci. Technol. Res. 2014;20:899–904. doi: 10.3136/fstr.20.899. [DOI] [Google Scholar]
- Franco W. Pérez-Díaz I. M. Johanningsmeier S. D. McFeeters R. F. Appl. Environ. Microbiol. 2012;78:1273–1284. doi: 10.1128/AEM.06605-11. [DOI] [PMC free article] [PubMed] [Google Scholar]
- Liang H. Chen H. Zhang W. Yu C. Ji C. Lin X. LWT–Food Sci. Technol. 2018;91:460–466. doi: 10.1016/j.lwt.2018.01.088. [DOI] [Google Scholar]
- Xiao Y. S. Xiong T. Peng Z. Liu C. G. Huang T. Yu H. Xie M. Y. Food Res. Int. 2018;114:123–132. doi: 10.1016/j.foodres.2018.06.051. [DOI] [PubMed] [Google Scholar]
- Bennik M. H. Vorstman W. Smid E. J. Gorris L. G. Food Microbiol. 1998;15:459–469. doi: 10.1006/fmic.1998.0187. [DOI] [Google Scholar]
- Taniwaki M. H. Hocking A. D. Pitt J. I. Fleet G. H. Int. J. Food Microbiol. 2009;132:100–108. doi: 10.1016/j.ijfoodmicro.2009.04.005. [DOI] [PubMed] [Google Scholar]
- Gänzle M. G. Curr. Opin. Food Sci. 2015;2:106–117. doi: 10.1016/j.cofs.2015.03.001. [DOI] [Google Scholar]
- Jeong S. H. Lee S. H. Jung J. Y. Choi E. J. Jeon C. O. J. Food Sci. 2013;78:M763–M769. doi: 10.1111/1750-3841.12095. [DOI] [PubMed] [Google Scholar]
- Jiang T. Gao C. Ma C. Xu P. Trends Microbiol. 2014;22:589–599. doi: 10.1016/j.tim.2014.05.008. [DOI] [PubMed] [Google Scholar]
- Zhao L. Zhang H. Hao T. Li S. Food Chem. 2015;187:370–377. doi: 10.1016/j.foodchem.2015.04.108. [DOI] [PubMed] [Google Scholar]
- Wang Z. X. Shao Y. Y. Food Microbiol. 2018;72:185–192. doi: 10.1016/j.fm.2017.12.003. [DOI] [PubMed] [Google Scholar]
- Caporaso J. G. Lauber C. L. Walters W. A. Berg-Lyons D. Lozupone C. A. Turnbaugh P. J. Fierer N. Knight R. Proc. Natl. Acad. Sci. 2011;108:4516. doi: 10.1073/pnas.1000080107. [DOI] [PMC free article] [PubMed] [Google Scholar]
- Caporaso J. G. Kuczynski J. Stombaugh J. Bittinger K. Bushman F. D. Costello E. K. Fierer N. Peña A. G. Goodrich J. K. Gordon J. I. Huttley G. A. Kelley S. T. Knights D. Koenig J. E. Ley R. E. Lozupone C. A. McDonald D. Muegge B. D. Pirrung M. Reeder J. Sevinsky J. R. Turnbaugh P. J. Walters W. A. Widmann J. Yatsunenko T. Zaneveld J. Knight R. Nat. Methods. 2010;7:335. doi: 10.1038/nmeth.f.303. [DOI] [PMC free article] [PubMed] [Google Scholar]
- Magoč T. Salzberg S. L. Bioinformatics. 2011;27:2957–2963. doi: 10.1093/bioinformatics/btr507. [DOI] [PMC free article] [PubMed] [Google Scholar]
- Edgar R. C. Nat. Methods. 2013;10:996. doi: 10.1038/nmeth.2604. [DOI] [PubMed] [Google Scholar]
- Edgar R. C. Haas B. J. Clemente J. C. Quince C. Knight R. Bioinformatics. 2011;27:2194–2200. doi: 10.1093/bioinformatics/btr381. [DOI] [PMC free article] [PubMed] [Google Scholar]
- Quast C. Pruesse E. Yilmaz P. Gerken J. Schweer T. Yarza P. Peplies J. Glöckner F. O. Nucleic Acids Res. 2012;41:D590–D596. doi: 10.1093/nar/gks1219. [DOI] [PMC free article] [PubMed] [Google Scholar]
- National Food Safety Standard: The allowable amounts of contaminants in food, China Food and Drug Administration, 2017, GB 2762-2017 [Google Scholar]
- WHO, Evaluation of certain food additives, Joint FAQ/WHO Expert Committee on Food Additives (JECFA), Geneva, 2002 [Google Scholar]
- Liu L. She X. Qian Y. Li Y. Tao Y. Che Z. Liu G. Rao Y. LWT–Food Sci. Technol. 2019;111:829–836. doi: 10.1016/j.lwt.2019.05.024. [DOI] [Google Scholar]
- Wang Z. Shao Y. Food Microbiol. 2018;72:185–192. doi: 10.1016/j.fm.2017.12.003. [DOI] [PubMed] [Google Scholar]
- Park S.-E. Yoo S.-A. Seo S.-H. Lee K.-I. Na C.-S. Son H.-S. LWT–Food Sci. Technol. 2016;68:313–321. doi: 10.1016/j.lwt.2015.12.046. [DOI] [Google Scholar]
- Zhang F. Tang Y. Ren Y. Yao K. He Q. Wan Y. Chi Y. Int. J. Food Microbiol. 2018;275:32–38. doi: 10.1016/j.ijfoodmicro.2018.04.002. [DOI] [PubMed] [Google Scholar]
- Liang H. Chen H. Ji C. Lin X. Zhang W. Li L. Front. Microbiol. 2018;9:1–10. doi: 10.3389/fmicb.2018.00001. [DOI] [PMC free article] [PubMed] [Google Scholar]
- Liu D. Tong C. LWT--Food Sci. Technol. 2017;86:40–48. doi: 10.1016/j.lwt.2017.07.040. [DOI] [Google Scholar]
- Raichand R. Pareek S. Singh N. K. Mayilraj S. Int. J. Syst. Evol. Microbiol. 2012;62:2150–2155. doi: 10.1099/ijs.0.035790-0. [DOI] [PubMed] [Google Scholar]
- Rivière A. Selak M. Lantin D. Leroy F. De Vuyst L. Front. Microbiol. 2016;7:979. doi: 10.3389/fmicb.2016.00979. [DOI] [PMC free article] [PubMed] [Google Scholar]
- Zhang C. Chen J. Li X. Liu D. Food Res. Int. 2019;116:266–275. doi: 10.1016/j.foodres.2018.08.032. [DOI] [PubMed] [Google Scholar]
- Kang J. H. Lee J. H. Min S. Min D. B. J. Food Sci. 2003;68:849–854. doi: 10.1111/j.1365-2621.2003.tb08254.x. [DOI] [Google Scholar]
- Liu Z. Peng Z. Huang T. Guan Q. Li J. Xie M. Xiong T. J. Sci. Food Agric. 2019;99:3391–3397. doi: 10.1002/jsfa.9556. [DOI] [PubMed] [Google Scholar]
- Santos M. C. Nunes C. Rocha M. A. M. Rodrigues A. Rocha S. M. Saraiva J. A. Coimbra M. A. Food Chem. 2015;188:406–414. doi: 10.1016/j.foodchem.2015.05.002. [DOI] [PubMed] [Google Scholar]
- Pogačić T. Maillard M.-B. Leclerc A. Hervé C. Chuat V. Valence F. Thierry A. Appl. Microbiol. Biotechnol. 2016;100:2335–2346. doi: 10.1007/s00253-015-7227-4. [DOI] [PubMed] [Google Scholar]
- Kinzurik M. I. Herbst-Johnstone M. Gardner R. C. Fedrizzi B. J. Agric. Food Chem. 2015;63:8017–8024. doi: 10.1021/acs.jafc.5b02984. [DOI] [PubMed] [Google Scholar]
- Zhao N. Zhang C. C. Yang Q. Yang B. Lu W. W. Li D. Y. Liu X. M. Tian F. W. Zhang H. Chen W. RSC Adv. 2016;6:89671–89678. doi: 10.1039/C6RA12474G. [DOI] [Google Scholar]
Associated Data
This section collects any data citations, data availability statements, or supplementary materials included in this article.


