
Figure 2.
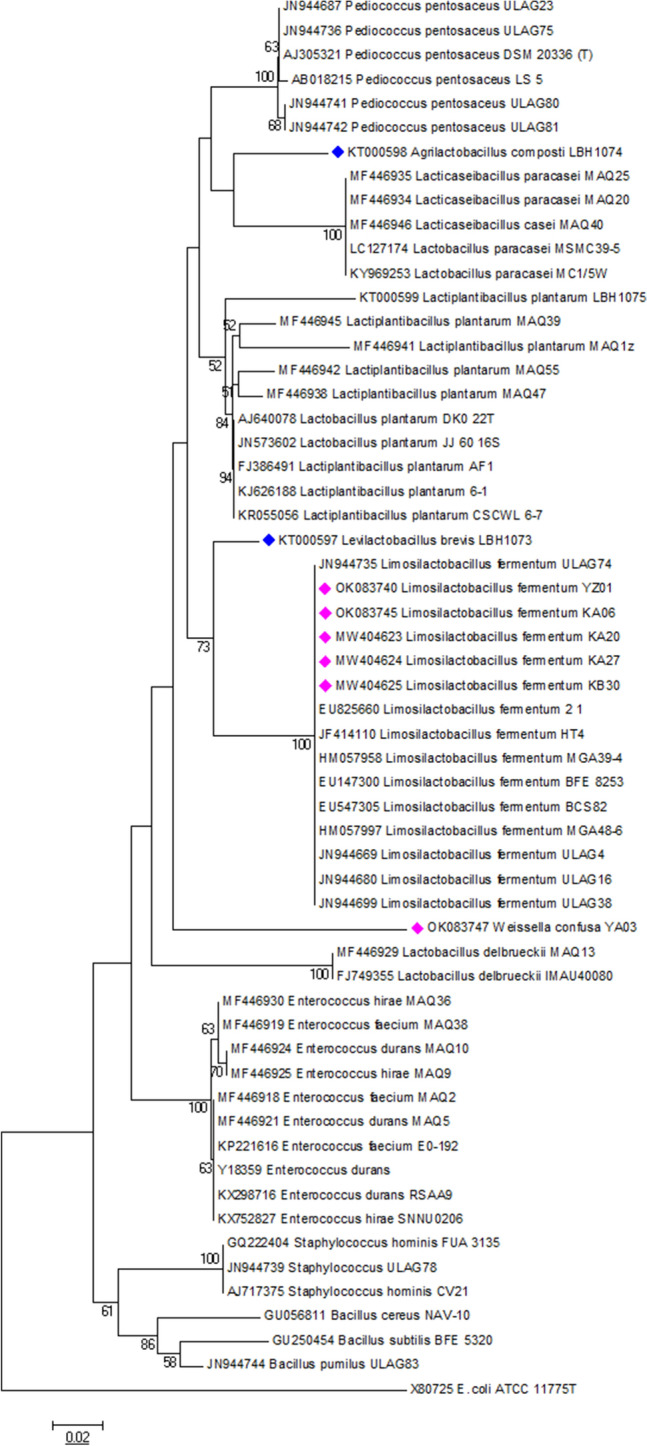
Phylogenetic tree of lactic acid bacteria producing α-Gal based on the alignment of the partial 16S rRNA sequences of the LAB isolates from this study. The evolutionary history was inferred using the Neighbor-Joining method. The optimal tree with the sum of branch length = 0.95913905 is shown. The percentage of replicate trees in which the associated taxa clustered together in the bootstrap test (1000 replicates) is shown next to the branches. The tree is drawn to scale, with branch lengths in the same units as those of the evolutionary distances used to infer the phylogenetic tree. The evolutionary distances were computed using the p-distance method and are in the units of the number of base differences per site. All positions containing gaps and missing data were eliminated. E. coli ATCC_117775T was used as an out group while LAB producing α-Gal was annotated with pink and blue colored bullets. Evolutionary analyses were conducted using MEGA6.