. 2022 Apr 25;11:e75018. doi: 10.7554/eLife.75018

Figure 2. Purkinje cell simple spike’s responses to neck proprioceptive stimulation.

(A) Proprioceptive stimulation was generated by applying body-under-head rotation about the vertical axis while holding the head earth. The resulting neural responses are illustrated for the same three example Purkinje cells shown above in Figure 1. The top two rows illustrate rotational head and body velocities. The bottom row shows the resultant simple spike firing rate (gray shaded regions) with the linear estimation of the firing rate based on body motion superimposed (green traces). The heat maps show the simple spike firing rate for individual trials. Insets: the relationship between simple spike firing rate (phase-corrected) and angular body-in-space velocity. (B, C) Distribution of proprioceptive sensitivities for the preferred (B) and non-preferred (C) directions of body movement. Filled versus open bars represent neurons that were sensitive versus insensitive to neck proprioceptive stimulation (i.e., bimodal versus unimodal cells, respectively). The dashed lines are fits on the distributions. Insets: polar plots where the vector length and angle represent each neuron’s proprioceptive response sensitivity and phase, respectively. Filled versus open arrows represent the population-averaged vectors for neurons with Type I versus II vestibular responses (i.e., Figure 1), respectively.

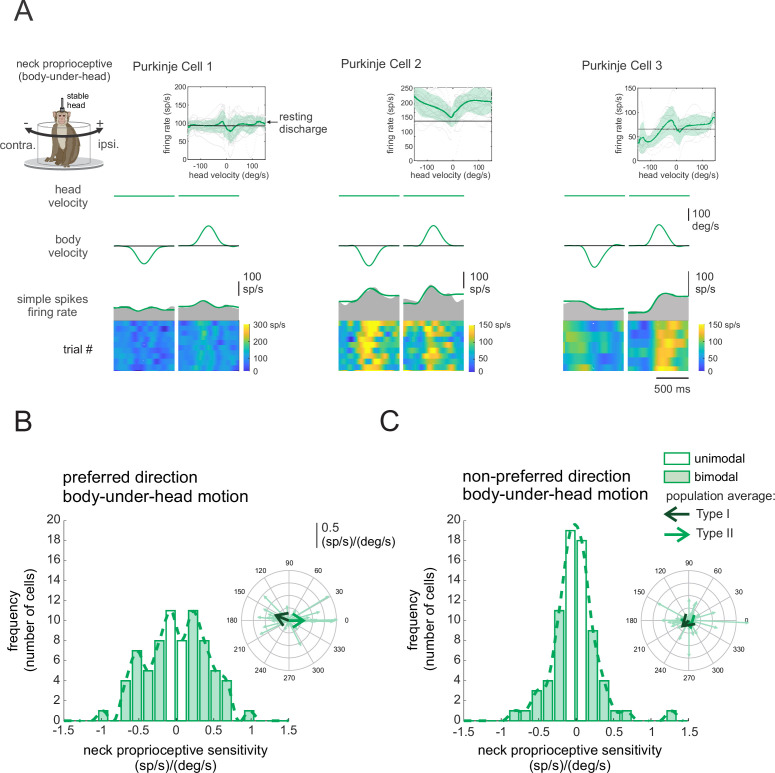
Figure 2.

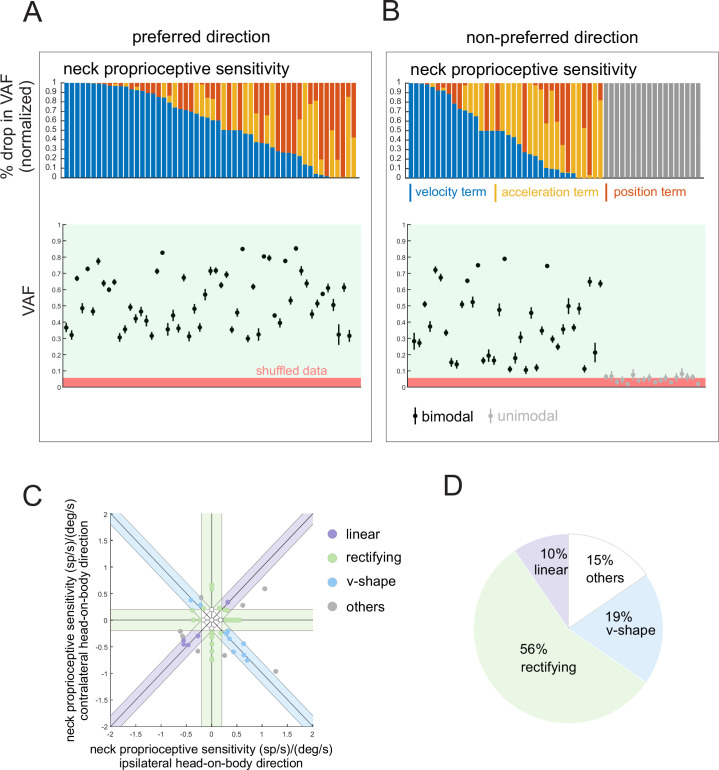
Figure 2—figure supplement 1. Purkinje cells show heterogeneity in their simple spike responses to proprioceptive stimulation.

Figure 2—figure supplement 1.

(A) The contribution of each kinematic term (i.e., position, velocity, acceleration) in estimating the firing rate for the preferred (left) and non-preferred (right) direction of body movement (i.e., body-under-head) for bimodal Purkinje cells, computed as the % drop in total variance-accounted-for (VAF) when removed from the full model. Neurons that did not significantly respond to the non-preferred direction are shown as gray bars. Note, we sorted the Purkinje cells based on the importance of the velocity term, since this is what is predominately encoded by the target neurons in the rostral fastigial nucleus (rFN) and vestibular nuclei. (B) The computed VAF (mean ± 95% CI) in estimating the firing rate for preferred (left) and non-preferred (right) direction of whole-body movement. Black and gray bars represent bimodal and unimodal Purkinje cells, respectively. The red area corresponds to non-significant VAF values computed from the same stimulation and shuffled inter-spike intervals (ISI). (C) The response of the bimodal Purkinje cells, which are grouped as (i) linear, which demonstrated increased and decreased firing rate in the preferred and non-preferred directions, respectively, (ii) V-shape, which demonstrated increased firing rate in both directions, (iii) rectifying, which demonstrated increased firing rate in the preferred direction and minimal modulation in the non-preferred direction, and (iv) others, which did not meet any of the mentioned criteria. (D) The pie chart illustrates the percentage of each category within the Purkinje cells.
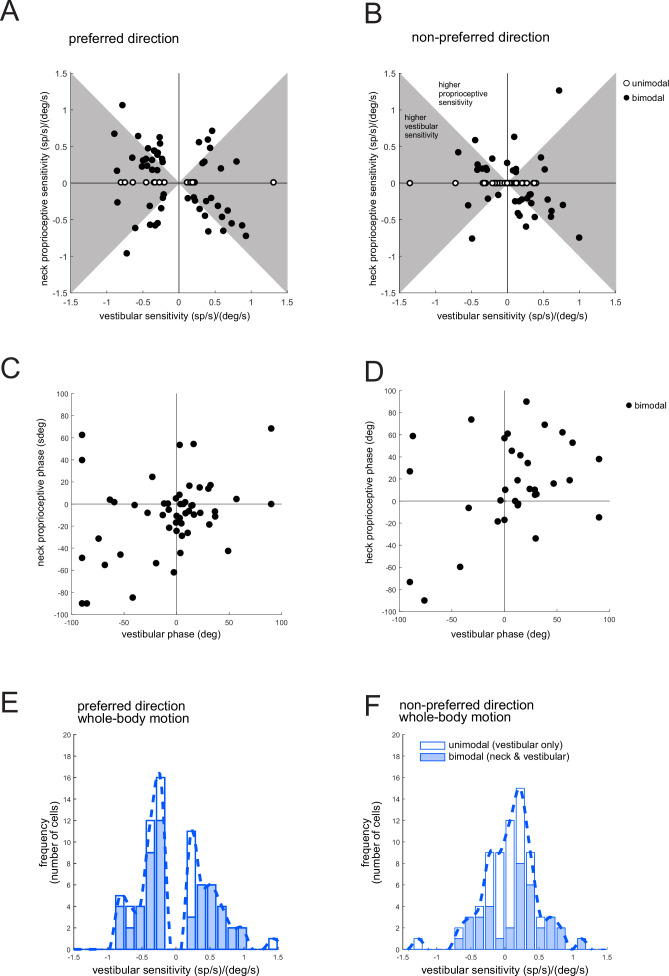
Figure 2—figure supplement 2. Purkinje cells show heterogeneity in their simple spike responses to vestibular versus proprioceptive stimulation.

Figure 2—figure supplement 2.

(A, B) Scatter plots comparing the sensitivity to vestibular and neck proprioceptive stimulation for unimodal (white circles) and bimodal (black circles) Purkinje cells for preferred (A) and non-preferred (B) direction of movement. The gray shaded area corresponds to the Purkinje cells with larger sensitivity to vestibular compared to neck proprioceptive sensitivity. (C, D) Scatter plots comparing the phase of the responses to vestibular and neck proprioceptive stimulation for bimodal Purkinje cells for the preferred (C) and non-preferred (D) direction of movement. (E, F) The distribution of the neuronal sensitivity of the Purkinje cells simple spikes’ response to the vestibular stimulation for the preferred (E) and non-preferred (F) direction of movement. Open bars correspond to the cells that did not show a significant response to the neck proprioceptive stimulation (i.e., unimodal cells).
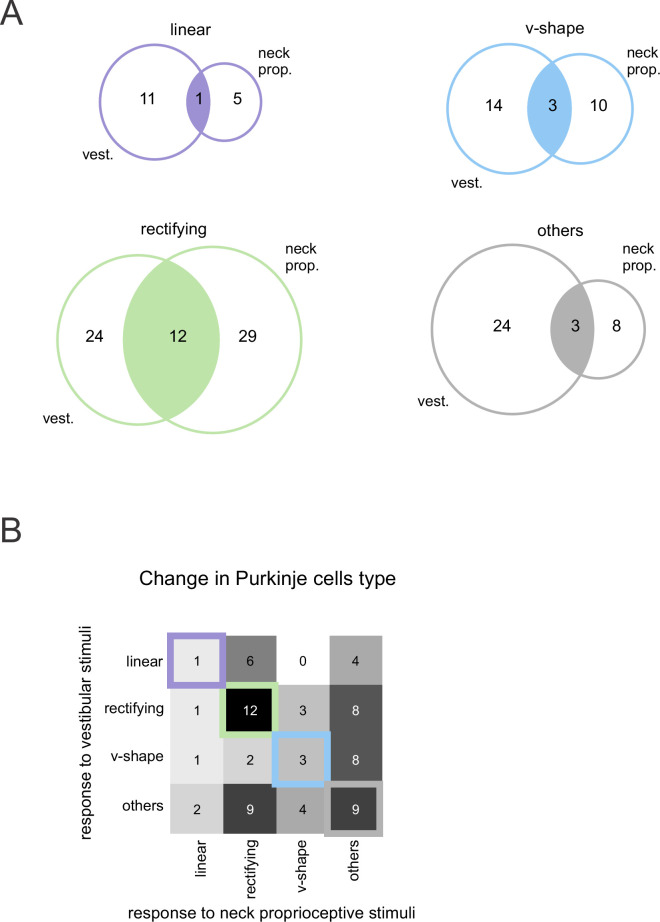
Figure 2—figure supplement 3. For most of the Purkinje cells, the responses to vestibular and neck proprioceptive stimulation were classified in different groups.

Figure 2—figure supplement 3.

(A) Venn diagram showing the number of Purkinje cells that were grouped as linear, v-shape, rectifying, and other for vestibular and neck proprioceptive responses and their overlap (filled area). (B) The number of Purkinje cells that were classified in pairs of groups based on their response to vestibular (y-axis) and neck proprioceptive (x-axis) inputs.