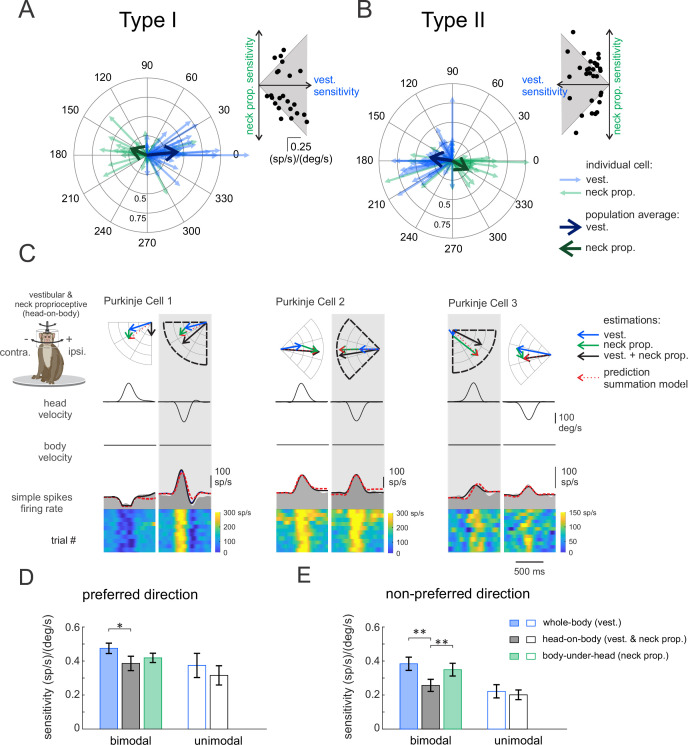
Figure 3. Purkinje cells simple spike’s responses to combined vestibular-proprioceptive stimulation.
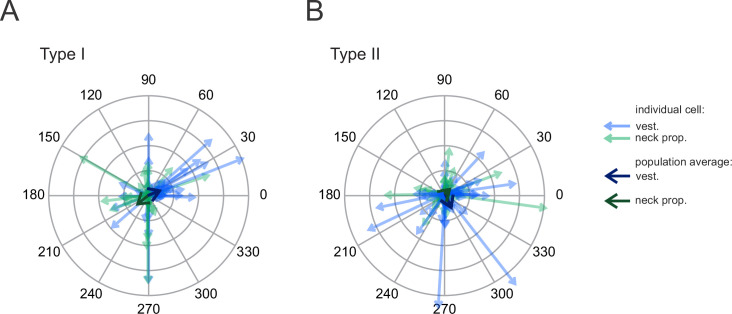
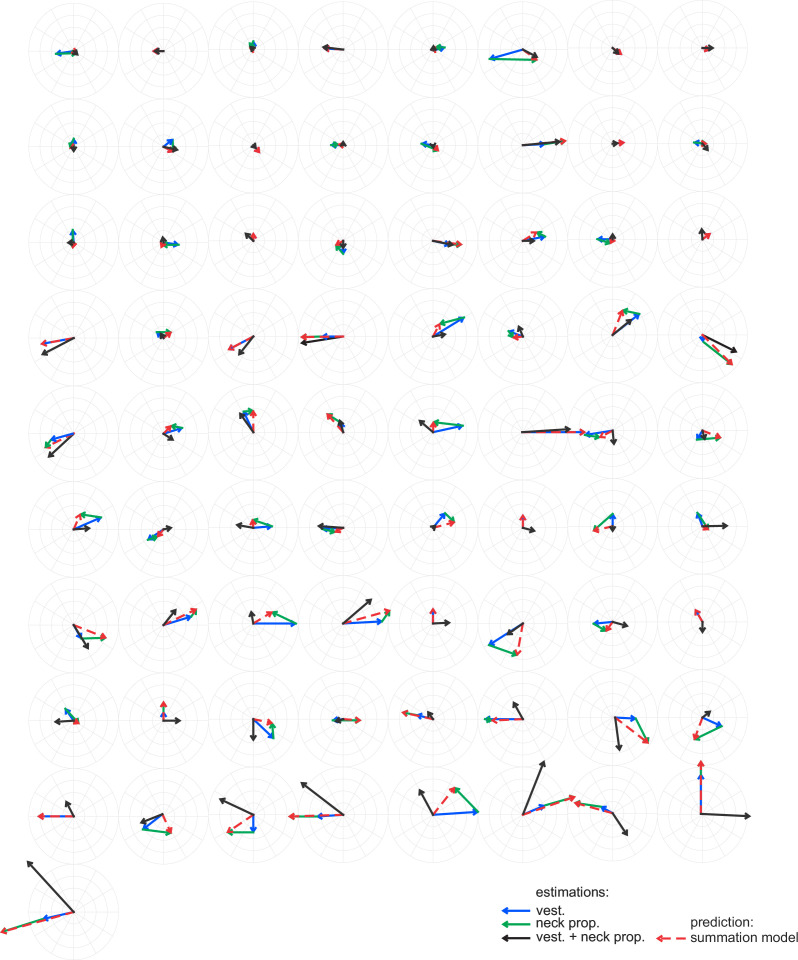
(A, B) Polar plots illustrating the vestibular (blue) and neck proprioceptive (green) neuronal response sensitivities of Type I (A) and Type II (B) Purkinje cells for preferred direction of vestibular stimulation and complementary direction proprioceptive stimulation (i.e., body-under-head motion). Bold blue and green arrows represent the mean population vectors, respectively. Inset: scatter plots comparing the sensitivity of Type I (A) and Type II (B) Purkinje cells to vestibular and neck proprioceptive inputs. (C) Combined vestibular-proprioceptive stimulation was generated by applying passive head-on-body rotations about the vertical axis. The resulting neural responses are shown for the same three example Purkinje cells shown above in Figures 1 and 2. The top two rows illustrate rotational head and body velocity. The bottom row shows the resultant simple spike firing rate (gray shaded regions). The linear estimation of firing rate based on head motion (solid black traces) and the firing rate prediction based on the linear summation of neck proprioceptive and vestibular sensitivities (dashed red traces) are both superimposed. Each neuron’s preferred motion direction for vestibular stimulation is indicated by the gray column. Polar plots (top) represent the sensitivity and phase of each neuron’s response to vestibular, proprioceptive, and combined stimulation as well as the response predicted by the summation model. (D, E) Bar plots comparing the sensitivities of bimodal and unimodal Purkinje cells to vestibular, proprioceptive, and combined stimulation in the preferred (D) and non-preferred (E) motion directions, as defined by each neuron’s responses to vestibular stimulation. The response sensitivities of Type I and II neurons are reported as positive values relative to ipsilaterally and contralaterally directed head movements, respectively, to facilitate comparison across all Purkinje cells.


