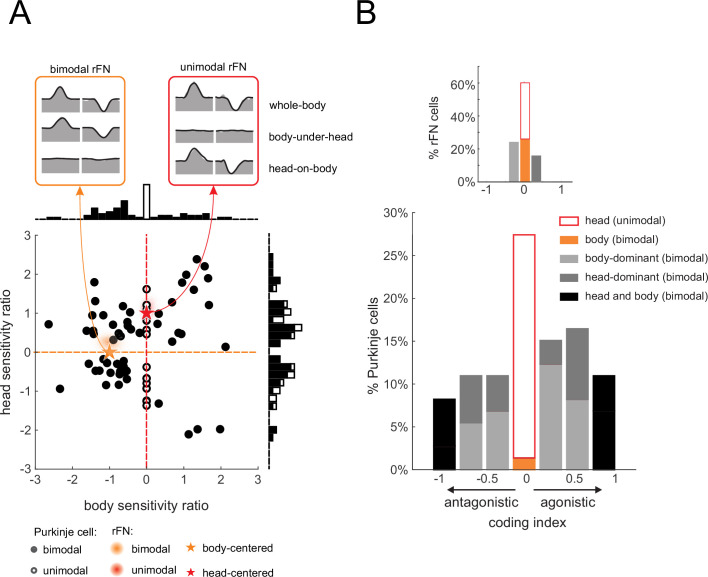
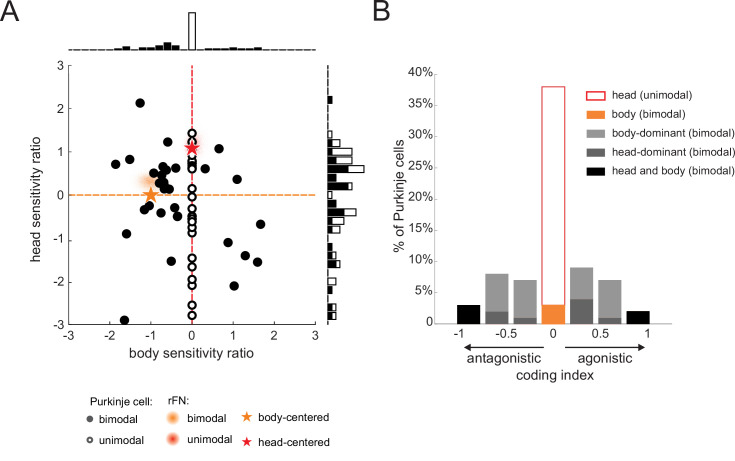
Figure 5. Heterogeneity in Purkinje cell simple spike encoding of head and body movement.
(A) Scatter plot of the relationship between the head sensitivity ratio (Svest.+prop./Svest.) and body sensitivity ratio (Sprop./Svest.) for the preferred direction. Histograms (top and right) illustrate the distributions of body and head sensitivity ratios, respectively. Orange versus red stars indicate ideal encoding of body versus head movement in space, respectively. For comparison, the red and orange shaded areas representing the distribution of values estimated for unimodal and bimodal rostral fastigial nucleus (rFN) neurons (Brooks and Cullen, 2009) are superimposed. Inset: examples of the responses of a bimodal (orange) and unimodal (red) rFN neurons during whole-body, body-under-head, and head-on-body movement are shown for comparison (Figure 5A has been adapted from Figure 1 from Brooks and Cullen, 2013). (B) Distribution of coding indexes (see Materials and methods). Positive and negative values correspond to agonistic and antagonistic responses to head versus body encoding, respectively. Inset: the distribution of coding indices estimated for rFN neurons (Brooks and Cullen, 2009) is shown for comparison.


