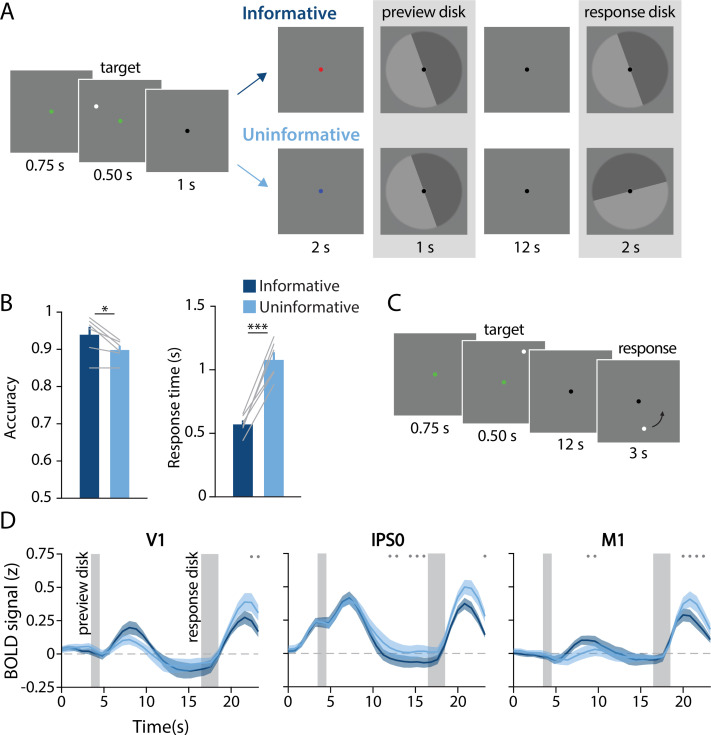
Figure 1. Task design, behavioral results, and univariate results.
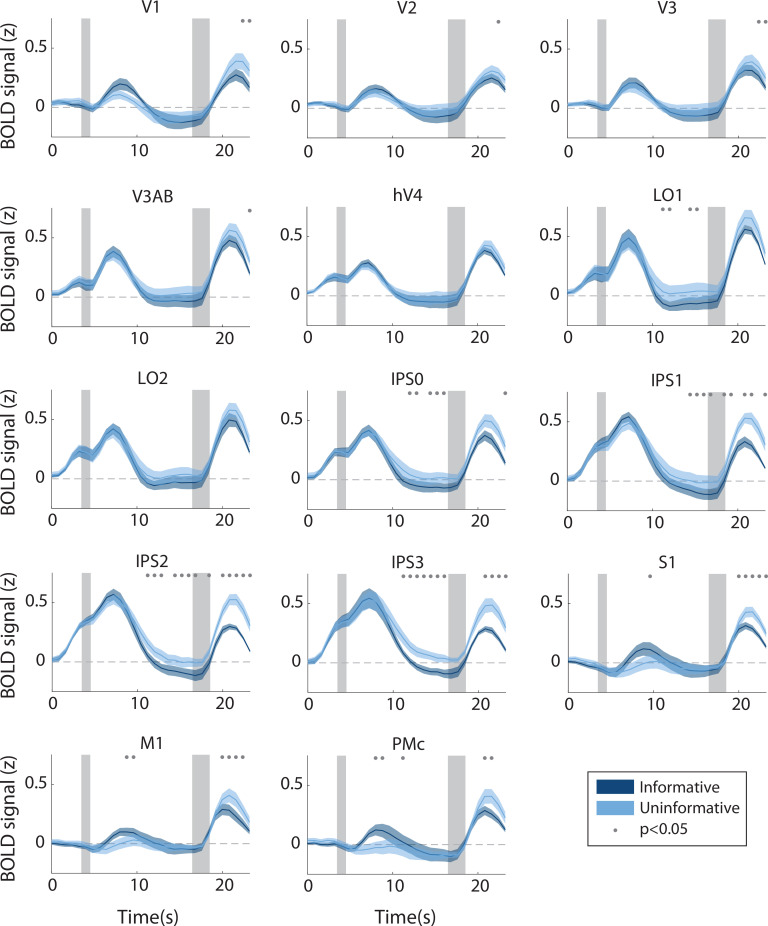
(A) During each trial of the main working memory task, participants remembered the spatial position of a target dot presented at a random angular position (7° eccentricity from fixation). After a 16 s delay, participants made a binary response to indicate which half of a ‘response’ disk the target dot position had been presented on. At the beginning of the delay, a ‘preview’ disk was shown that either exactly matched the response disk (top row; ‘informative’) or had a random orientation relative to the response disk (bottom row; ‘uninformative’). In the example trial depicted, a participant in the informative condition would have pressed the button corresponding to the lighter gray side of the disk. By contrast, in the uninformative condition a participant would have pressed the button corresponding to the dark gray side, as only the final response disk was relevant to their response (see Methods, Task: Main working memory for more details). (B) Average behavioral accuracy (left) and response time (right) in the informative and uninformative conditions (individual participants are shown with gray lines). Error bars represent ±1 SEM across participants. Significance of condition differences was computed using paired t-tests (a single asterisk indicates p<0.05, and three asterisks indicate p<0.001). (C) In a separate spatial working memory mapping task, participants remembered a target dot position for 12 s and responded by moving a probe dot around an invisible circle to match the remembered position (see Methods, Task: Spatial working memory mapping). This mapping task was used to generate an independent dataset to train decoding models (see Methods, Analysis: Spatial position decoding). (D) Univariate hemodynamic response functions in three representative regions of interest from early visual cortex (V1), parietal cortex (IPS0), and motor cortex (M1) during the informative (dark blue) and uninformative (light blue) conditions of the main working memory task. Timepoint zero indicates the onset of the memory target. Shaded gray rectangles indicate the time periods when the ‘preview’ disk was onscreen (3.5–4.5 s) and when the response disk was onscreen (16.5–18.5 s). Shaded error bars represent ±1 SEM across participants. Gray dots indicate timepoints showing a significant condition difference (evaluated using a Wilcoxon signed-rank test with permutation, all p-values <0.05; see Methods, Analysis: Univariate for details). This plot shows three representative ROIs, see Figure 1—figure supplement 1 for data from all ROIs.


