. 2022 May 6;11:e75688. doi: 10.7554/eLife.75688

Figure 2. Visual and parietal areas represent spatial position more strongly during trials that require sensory-like spatial memory than during trials that allow re-coding into action-oriented memory.

(A) Schematic of the decoding procedure. Continuous values of angular position were divided into eight discrete bins, and four binary decoders were trained to discriminate between patterns corresponding to bins 180° apart. The final decoding accuracy was the average accuracy over these four binary decoders. (B) Decoding accuracy for each region of interest (ROI) and task condition. The spatial decoder was always trained on data from the delay period of an independent spatial working memory mapping task (Figure 1C), and tested on data from the delay period of the main working memory task (averaged within a window 8–12.8 s from start of trial; see Methods, Analysis: Spatial position decoding for more details). Error bars reflect ±1 SEM across participants, and light gray lines indicate individual participants. Dots above bars and pairs of bars indicate the level of statistical significance within each condition, and between conditions, respectively (two-tailed p-values obtained using a Wilcoxon signed-rank test with permutation testing, see Methods, Analysis: Spatial position decoding). Dot sizes reflect significance level. (C) Spatial decoding accuracy over time in three example ROIs. Timepoint zero indicates the target onset time. Shaded gray rectangles indicate the periods of time when the ‘preview’ (3.5–4.5 s) and ‘response’ (16.5–18.5 s) disks were onscreen. Shaded error bars represent ±1 SEM across participants, colored dots indicate significance of decoding within each condition, and gray dots indicate significant condition differences, with dot sizes reflecting significance levels as in B. Gray brackets just above the x-axis in (C) indicate the time range over which data were averaged to produce (B) (i.e. 8–12.8 s). See Figure 2—figure supplement 1 for time-resolved spatial decoding in all visual and motor ROIs.

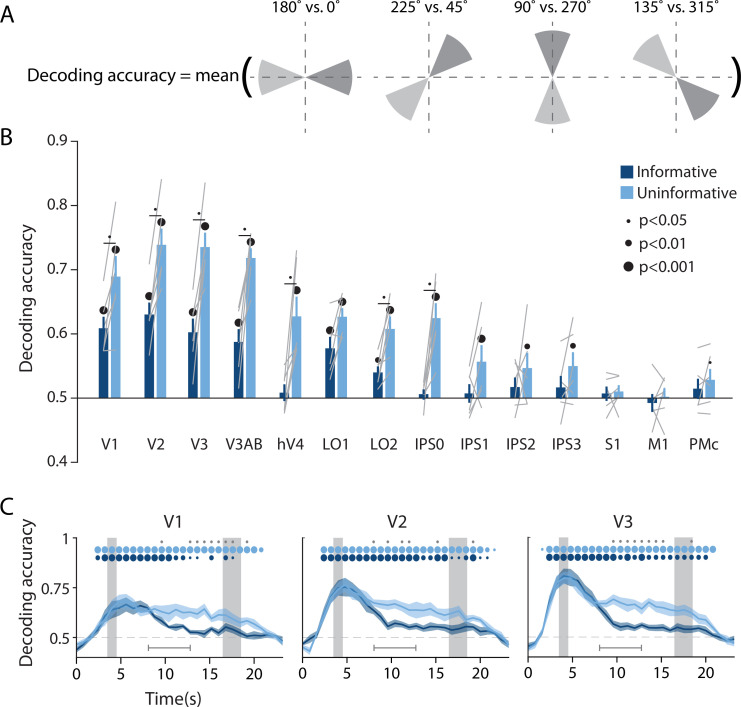
Figure 2.

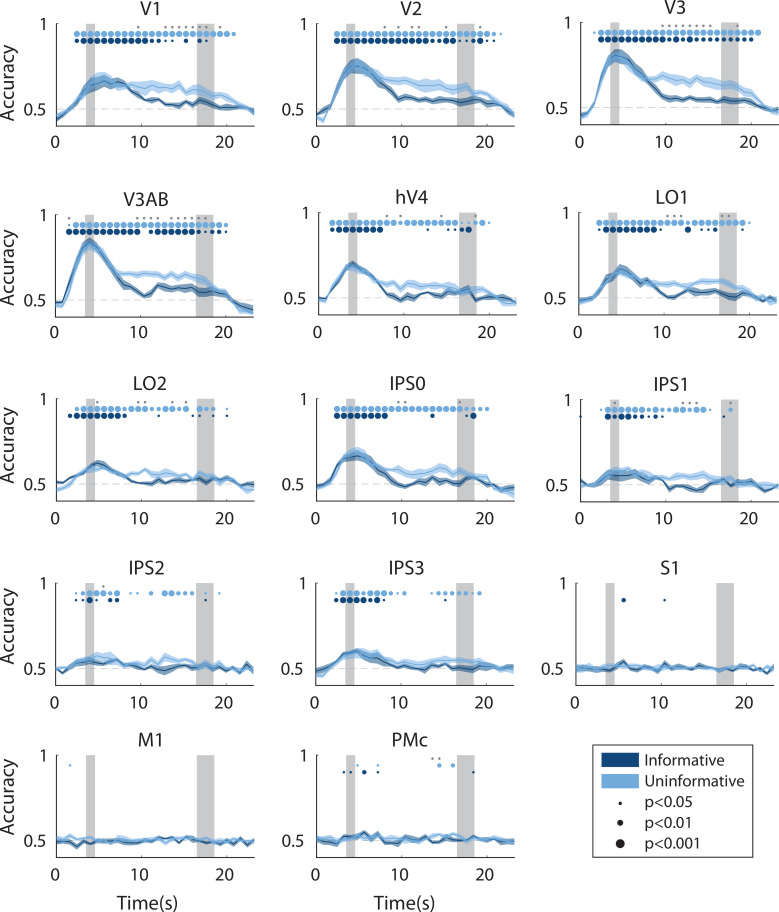
Figure 2—figure supplement 1. Time-resolved spatial decoding accuracy in every region of interest (ROI).

Figure 2—figure supplement 1.

All decoding was done using the spatial working memory mapping task as a training set (see Methods, Analysis: Spatial position decoding for details). Timepoint zero indicates the time of target onset; shaded gray rectangles indicate the periods of time when the ‘preview’ disk was onscreen (3.5–4.5 s) and when the response disk was onscreen (16.5–18.5 s). Shaded error bars represent ±1 SEM across participants, colored dots indicate significance of decoding within each condition, and gray dots indicate significant condition differences, with dot sizes reflecting significance levels.

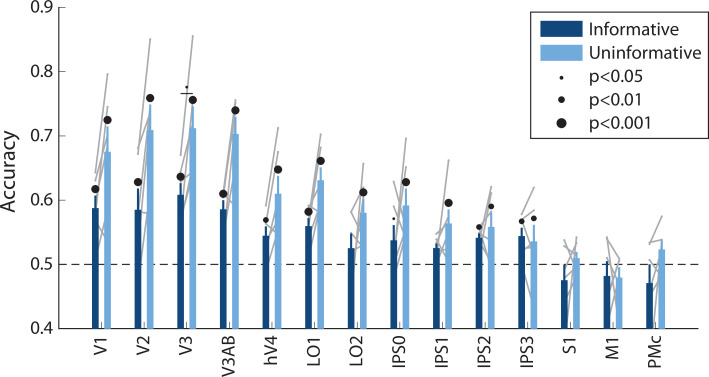
Figure 2—figure supplement 2. Spatial decoding performance differs across conditions, even when training and testing a decoder within each task condition separately.

Figure 2—figure supplement 2.

See Methods, Analysis: Spatial position decoding for details on classification procedure. Notably, within-condition spatial decoding showed a highly similar pattern of results to the analysis using the independent training set (Figure 2B), though the condition differences were slightly smaller (two-way repeated measures ANOVA with ROI and task condition as factors: main effect of ROI: F(13,65) = 12.873, p<0.001; main effect of condition: F(1,5) = 11.461, p=0.017; ROI × condition interaction: F(13,65) = 2.581, p=0.011; p-values obtained using permutation test; see Methods). Error bars reflect ±1 SEM across participants, and light gray lines indicate individual participants. Dots above bars and pairs of bars indicate the statistical significance of decoding within each condition, and of condition differences, respectively, both evaluated using non-parametric statistics. Dot sizes reflect significance level.

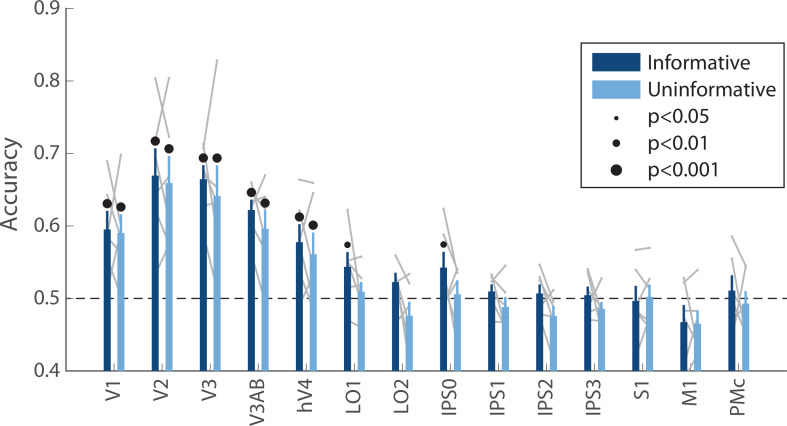
Figure 2—figure supplement 3. Decoding accuracy for the orientation of the ‘preview’ disk stimulus (see Figure 1A).

Figure 2—figure supplement 3.

Decoding accuracy for this stimulus, which briefly appeared on the screen early in the delay period, was similar across conditions (two-way repeated measures ANOVA with ROI and task condition as factors: main effect of ROI: F(13,65) = 13.4, p<0.001; main effect of task condition: F(1,5) = 2.164, p=0.193; ROI × condition interaction F(13,65) = 0.500, p=0.932; p-values obtained using permutation test; see Methods). Decoding was performed using data averaged over a time window 4.8–9.6 s into the trial, see Methods, Analysis: Disk orientation decoding for details. Error bars reflect ±1 SEM across participants, and light gray lines indicate individual participants. Dots above bars and pairs of bars indicate the statistical significance of decoding within each condition, and of condition differences, respectively, both evaluated using non-parametric statistics. Note that in this analysis, no significant condition differences were detected, and thus there are no dots above pairs of bars. Dot sizes reflect significance level.