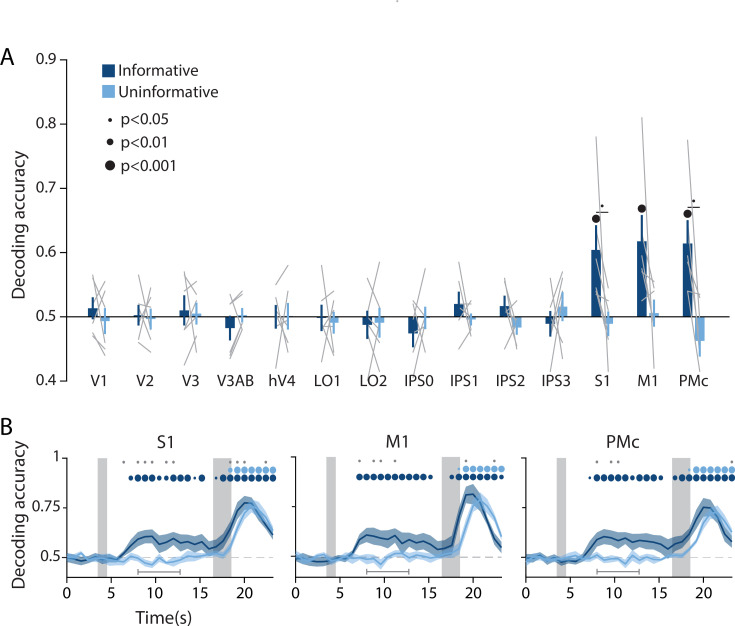
Figure 3. Action-oriented memory representations can be decoded from sensorimotor regions of interest (ROIs) during the delay period.
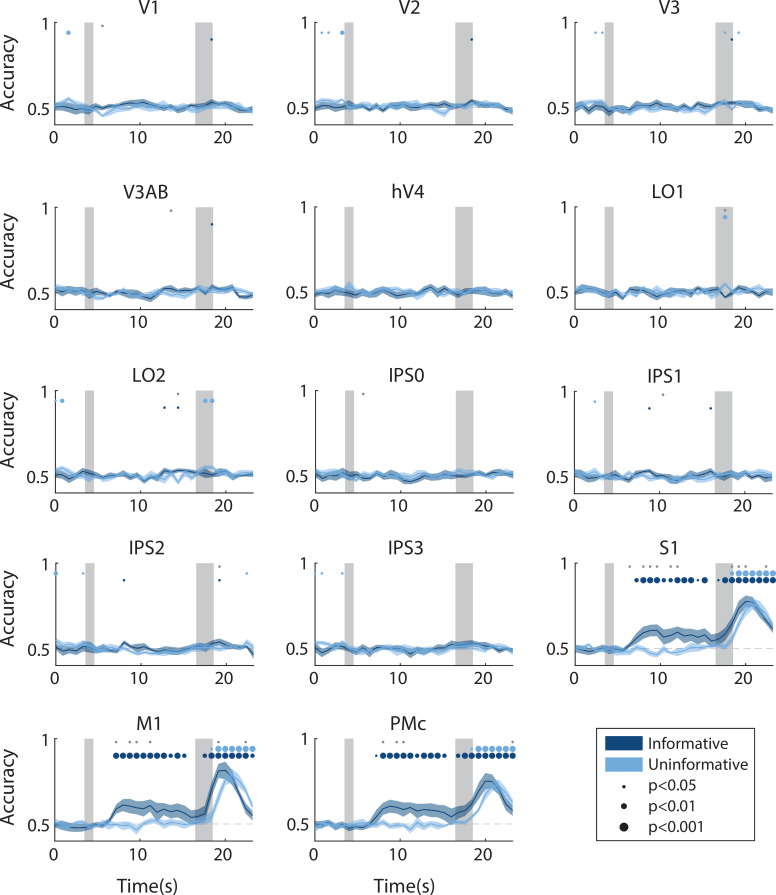
(A) A linear decoder was trained to classify the finger (left or right index) associated with the correct motor action on each trial, using data measured during the delay period of trials in each task condition separately (averaged within a window 8–12.8 s from start of trial; see Methods, Analysis: Action decoding for more details). Error bars reflect ±1 SEM across participants, and light gray lines indicate individual participants. Dots above bars and pairs of bars indicate the statistical significance of decoding accuracy within each condition, and of condition differences, respectively (two-tailed p-values obtained using a Wilcoxon signed-rank test with permutation testing, see Methods, Analysis: Action decoding). Dot sizes reflect significance level. (B) Action decoding accuracy over time in three example ROIs. Timepoint zero indicates the target onset time. Shaded gray rectangles indicate the periods during which the ‘preview’ (3.5–4.5 s) and ‘response’ (16.5–18.5 s) disks were onscreen. Shaded error bars represent ±1 SEM across participants. Colored dots indicate significance of decoding accuracy within each condition, and gray dots indicate significant condition differences, with dot sizes reflecting significance levels as in A. Gray brackets just above the x-axis in (B) indicate the time range in which data were averaged to produce (A) (8–12.8 s). For time-resolved decoding in all ROIs, see Figure 3—figure supplement 1.


