. 2022 May 6;11:e71845. doi: 10.7554/eLife.71845

Figure 5. Zic1 regulates dorsal-specific expression of genes in the somites.

(A) Schematic representation of preparation of dorsal and ventral somite cells for RNA-seq and ATAC-seq. (B) Schematic representation of generating the transgenic line Tg(zic1:zic1-Myc);Da. Somites expressing zic1-Myc are subjected to ChIPmentation against Myc. (C) Analysis of RNA-seq revealed that 694 genes are expressed specifically in the dorsal somites (among these genes are zic1, zic4 and wnt11) and 724 genes are expressed specifically in ventral somites. Magenta indicates differentially expressed genes (adjusted p-value < 0.01). (D) The ChIPmentation against Zic1 revealed that 324 of dorsal-high genes, 192 dorsal-low genes and 2716 non differential expressed genes in the somites are potential Zic1 target genes.

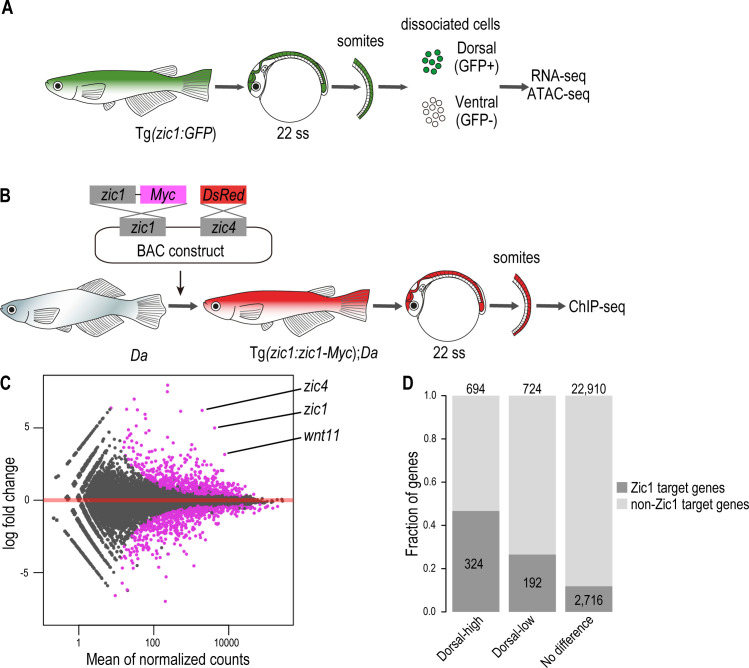
Figure 5.

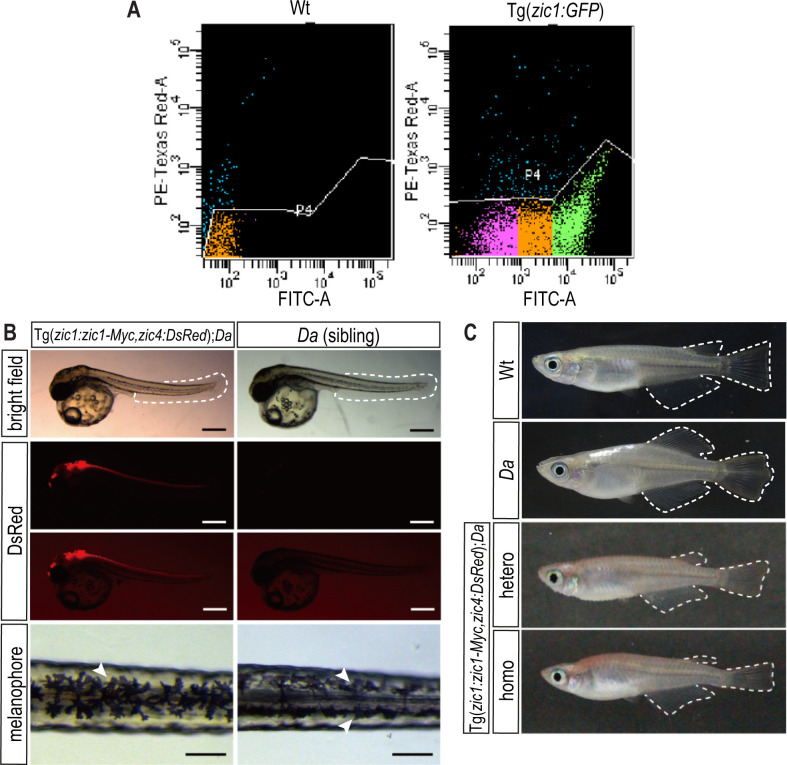
Figure 5—figure supplement 1. In Tg(zic1:zic1-Myc);Da fish, the ventralized trunk phenotype is rescued.

Figure 5—figure supplement 1.

(A) A representative flow cytometry plot of GFP expression in somite cells. Cells in green and magenta regions were collected as GFP positive and negative cells, respectively. PE-Texas Red-A indicates dead cells by PI staining. FITC shows GFP signal intensity. (B, C) Da phenotype is rescued in the transgenic line Tg(zic1:zic1-Myc);Da. (B) DsRed is expressed in the neural tube and dorsal somites, mimicking the endogenous expression of zic1 and zic4 (scale bar = 500 μm). Da mutant embryos display two rows of melanophores on the dorsal midline of their trunk (arrowheads, scale bar = 100 μm). In Tg(zic1:zic1-Myc);Da embryos, as in Wt embryos, a single row of melanophores (arrowhead) on the dorsal midline is found. (C) Ventralized phenotypes of adult Da mutants (including body shape, pigmentation, fin shape (outlined)) are rescued in Tg(zic1:zic1-Myc);Da adult fish. Images of Wt and Da adult medaka were first shown in Figure 1B and D.
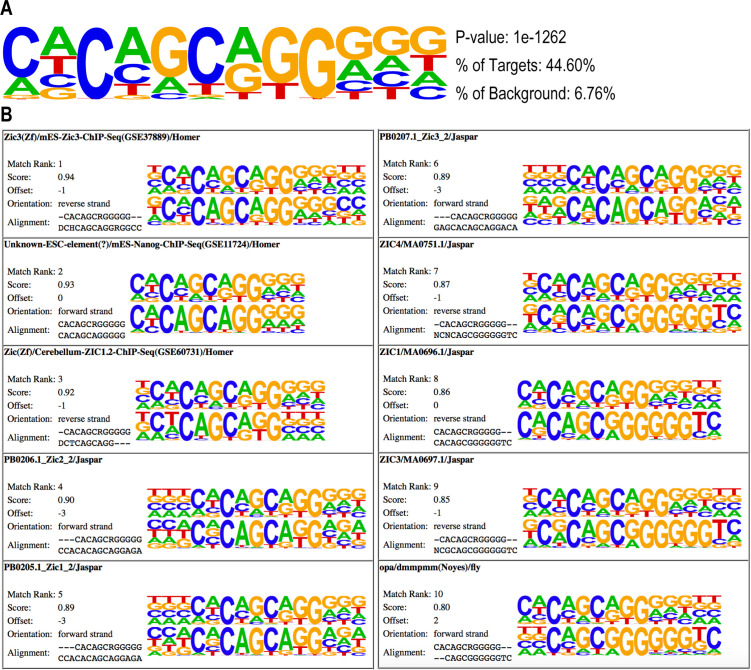
Figure 5—figure supplement 2. Common ZIC family DNA motifs are enriched in Zic1 peaks.

Figure 5—figure supplement 2.

(A) Top DNA motif enriched in Zic-Myc ChIPmentation peaks identified by HOMER. (B) Known motifs matched to DNA motif in (A). For each match, the upper motif, identified in this study (A), was compared to a known motif (lower motif). Matches were analyzed by HOMER.