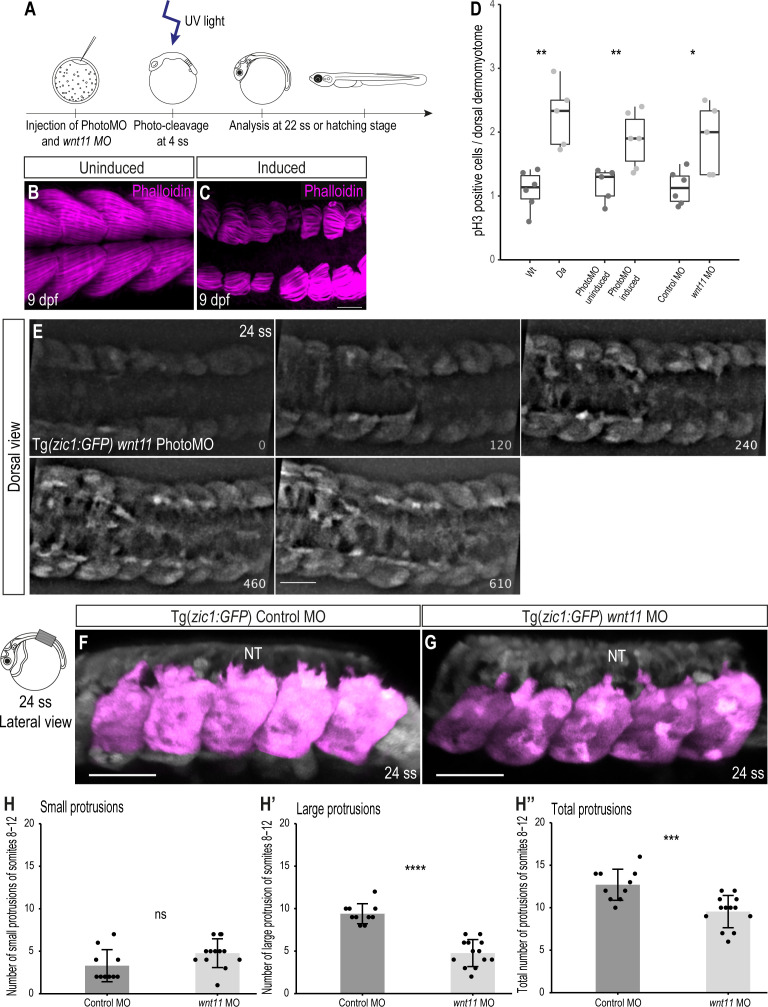
Figure 7. Knock-down of wnt11 in Wt embryos recapitulates the Da dorsal somite phenotype.
(A) Schematic outline of PhotoMO mediated knock-down of wnt11. (B, C) Dorsal view of maximum projection of whole-mount Phalloidin staining of 9 dpf embryos injected with PhotoMO but not photocleaved (B) and photo-cleaved (C). The epaxial myotomes of the wnt11 morphant are affected. (D) Quantification of pH3-positive cells in the dorsal DM of 22 ss embryos. Embryos with reduced levels of wnt11 in their dorsal somites (n = 40.5 somites from 5 Da embryos (adopted from Figure 2E), n = 61.5 somites of 6 wnt11 PhotoMO-Morphant embryos and n = 52 somites from 5 wnt11 morphant embryos) have significantly more pH3-positive cells in their dorsal DM compared to the respective controls (n = 66 somites from 6 Wt embryos (adopted from Figure 2E), n = 51 somites of 5 uninduced PhotoMO embryos and n = 65 somites from 6 Control MO embryos; p = 0.0035, 0.0091, 0.021, respectively). Median, first and third quartiles are shown. (E) Dorsal view of 24 ss Tg(zic1:GFP) embryo injected with wnt11 PhotoMO and photo-cleaved at 4 ss. Z-stacks were recorded every 10 min, time is displayed in min, and 15th somite is positioned in the center. (F, G) Lateral view of dorsal somites (colored magenta) of Tg(zic1:GFP) injected with Control MO (F) and wnt11 MO (G). (H-H’’) Quantification of protrusions formed by the 8th-12th somite of Tg(zic1:GFP) injected with Control MO (n = 10 embryos) or wnt11 MO (n = 13 embryos) (mean ± SD, p = 0.069 for small protrusions, p = 7.7e-08 for large protrusions, p = 0.00064 for total protrusions). Anterior to the left. NT, neural tube. Scale bar = 50 μm. *p < 0.05, **p < 0.01, ***p < 0.001, ****p < 0.0001, ns, not significant.


