
FIGURE 3.
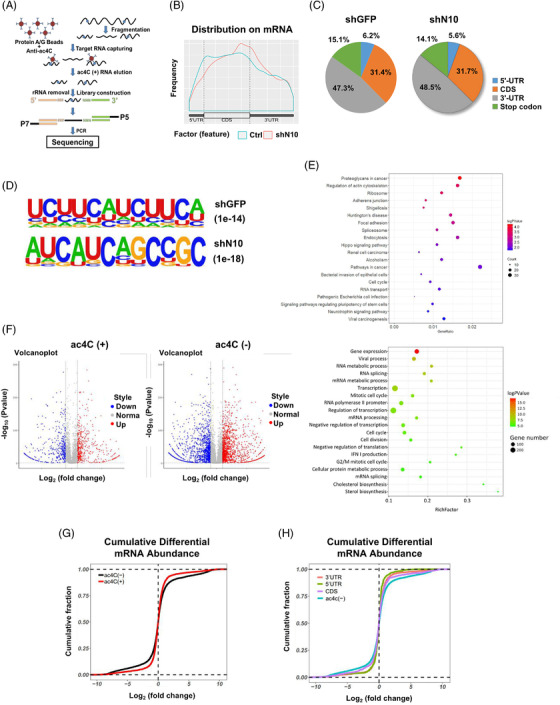
ac4C‐modified transcripts in BLCA cell lines are detected by acRIP‐sEquation (A) Schematic of acRIP‐seq for UMUC‐3 cells. (B) The distribution of ac4C‐containing peaks across mRNA in both control and NAT10 knockdown UMUC‐3 cells is displayed in metageneplot. (C) Representative pie chart of peak distribution exhibiting the proportion of total ac4C peaks in the indicated regions including 5′‐untranslated region (5′‐UTR), coding sequence (CDS), 3′‐ untranslated region (3′‐UTR) and stop codon. (D) Consensus motif of control and NAT10‐knockdown cells identified by HOMER. (E) Representative Pathway‐Analysis terms showing pathways of related genes significantly enriched by ac4C. (F) Volcano plots of differentially mRNA in control and NAT10 knockdown UMUC‐3 cells segregated by ac4C status. (G) Cumulative distribution function (CDF) plot showing differential expression of ac4C (–) or ac4C (+) transcripts in control and NAT10 knockdown UMUC‐3 cells. (H) CDF plot showing expression changes of protein‐coding genes in control and NAT10 knockdown UMUC‐3 cells for ac4C (–) and ac4C transcripts with peaks locate in the CDS, 5′UTR or 3′UTR