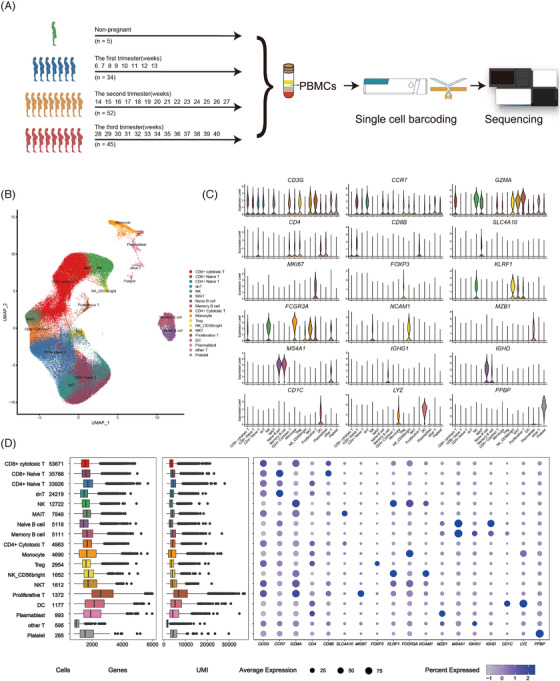
FIGURE 1.

Single‐cell gene expression profiling of PBMCs of the pregnant and non‐pregnant women. (A) Schematic representation of the study design. (B) The clustering result of 198, 356 cells from 136 donors. Each point represents one single cell, coloured according to cell type. (C) Violin plots of expression values for cell type‐specific marker genes. (D) From left to right are the cell number of each cell type, the box plot of the number of genes, the box plot of unique molecular identifiers (UMI) and the bubble plot of cell type‐specific marker genes
